22nd October 2021
Publication Information
Download Publication
- 6 MB PDF
- 22nd October 2021
Stay Informed
Get email updates about new ACCR research and shareholder advocacy on specific topics of interest to you.
Sign UpIn this section of our report, we review how decarbonisation will impact RDS’ existing business model, and how well RDS is positioned to respond to transition.
In FY20, RDS reported Adjusted Earnings (profit after tax excluding the impacts of one-off items such as impairments) of $4,846m, a decline of 70% on FY19. This was largely driven by lower production and prices for oil and gas during COVID-19. RDS’ return on capital (RoACE, Adjusted Earnings) has ranged between 3-8% over the last four years. As at 2Q21, RDS' net debt has decreased from $70bn in FY20 to $65bn, and gearing from to 32% to 28% (RDS format), which has improved RDS' financial capacity for investment and payment of dividends.
Chart: RDS Profit After Tax (US$m), Adjusted Earnings (US$m) and Return on Average Capital (RoACE %), FY17 to FY20
From FY17-FY20 RDS Group RoACE has ranged from 3% to 8%
We have estimated emissions by segment and compared this to the segment's financial returns (table below).
We have assumed Scope 1-3 emissions from RDS’ own production of oil and gas is allocated to Integrated Gas (including LNG liquefaction) and Upstream, and the Scope 1-3 emissions from sale of third-party oil and gas products to Oil Products. The Chemicals segment reflects Scope 1 and 2 emissions only, as RDS does not disclose Scope 3 GHG emissions for this segment.
Table: RDS segment and carbon summary FY20
| Segment | Adj. earnings (US$m) | Estimated % of RDS GHG emissions | Adj. earnings/ Average capital employed (%) | Commentary |
|---|---|---|---|---|
| Integrated Gas | 4,383 | 21% | 5.2% | Higher earnings to emissions than Oil Products. More capital intensive. |
| Upstream | -2,852 | 35% | -2.4% | FY20 impacted by weak oil production and prices. |
| Oil Products | 5,995 | 43% | 12.7% | Most stable earnings profile. Emission intensity driven by product sales. |
| Chemicals | 962 | 1%* | 4.4% | Emission intensity understated. Returns structurally low. |
| RDS Group | 4,846 | 2.8% |
Source: Company data,Global Climate Insights estimates. * Scope 1 and 2 only.
For FY20, Oil Products RoACE is highest at 12.7%, and has ranged from 13-17% over FY17 to FY19 (chart below). Oil Products’ GHG emissions footprint of ~43% of RDS Group is reflective of the product mix sold through RDS' large distribution network. We would expect this to decline as the carbon intensity of RDS products reduces.
RoACE for Upstream was impacted by COVID-19 in FY20. This segment is structurally more volatile and capital intensive than other segments, with FY20 RoACE of -2.4% and contributing 35% to RDS Group GHG emissions. Integrated Gas is also capital intensive, but has higher earnings than Upstream with RoACE of 5.2% in FY20, and 5-11% over FY17 to FY19. We estimate this segment is accountable for ~21% of RDS’ FY20 GHG emissions, although we expect this to increase significantly as RDS executes its LNG growth strategy.
The Chemicals segment represented ~11% of RDS Adjusted earnings in FY20; it is a small, but not insignificant segment. Chemicals’ returns are relatively low with FY20 RoACE of 4.4%, which has declined from 18% in FY17. The Chemicals industry has seen large margin pressure, and peers with less scale have divested their businesses (such as BP’s ~US$5bn sale of its Chemicals business in 2020). We expect the segment to continue to transform as a result of decarbonisation (move to recycled feedstocks) and focus on waste (less consumption of plastics).
RDS needs to set, measure, and disclose targets against all Chemicals GHG emissions (Scope 1-3). Currently, the company only accounts for emissions that come from its own chemical plants. RDS does not measure the emissions from further processing of chemicals to create end products by its customers (processes that are energy intensive), or measure impact from transportation, and end use. We expect these overlooked emissions to be significant, as the chemicals and petrochemicals sector ranks third behind iron and steel-making for contribution to global GHG emissions from industry.[1]
Chart: RDS % of Adjusted Earnings by segment (ex-corporate and non-controlling interests), FY17 to FY20
Contribution of Integrated Gas is large and has increased from 30% to 50% over the last 4 years
Oil products provided the largest contribution to FY20 earnings at ~70%
Chart: RDS RoACE (Adj. Earnings, %) by segment, FY17 to FY20
Oil Products RoACE is more stable than other divisions ranging from 13-17%
Source: Company data, Global Climate Insights estimates
RDS' ability to generate sufficient underlying profit for reinvestment and to withstand likely ongoing impairments is critical to the company’s future success. This needs to be achieved while shrinking rather than expanding its existing fossil fuel business.
Impairments increased significantly in FY20 to $27.5bn pre-tax, from $3.7bn in FY19. This was largely driven by revised pricing, margin, and demand assumptions due to changes in the energy market and COVID-19 impacts. The majority of impairments related to exploration and production assets ($20.2bn). This includes Integrated Gas impairments ($11.6bn) for the Queensland Curtis LNG and Prelude Floating LNG facilities, Upstream impairments ($8.7bn) relating to the Gulf of Mexico, assets in North America, Brazil and Europe, and ongoing issues in Nigeria. Impairments for manufacturing, supply and distribution were $6.5bn, reflecting Oil Products assets in Europe and the closure of Convent refinery (USA).
Chart: RDS Impairments (US$bn, pre-tax), FY17 to FY20
Impairments rose significantly from FY19 to $27.5bn
Driven by Integrated Gas (LNG and Prelude FLNG), Upstream assets in the Gulf of Mexico and broader portfolio and closure of the Convent refinery
Source: Company data, Global Climate Insights estimates
Property Plant and Equipment (PPE) is the largest asset on RDS' balance sheet at US$211bn (56% of total assets and 125% of equity). This is one of the largest risks to solvency. Fortunately, impairments are typically taken over time, providing the ability for company earnings to cover losses. However, it is unclear if this will be possible for an industry undergoing such a significant transformation.
Chart: RDS Property Plant and Equipment vs Equity (US$bn), FY17 to FY20
PPE of $211bn exceeds the value of equity
Further impairment of PPE represents a key risk to RDS
Source: Company data, Global Climate Insights estimates
RDS’ cash capital expenditure (including expenditure and investments) was ~$18bn in FY20 - a reduction of 25% on FY19. RDS has focused on capital efficiency, particularly given lower revenue in FY20. Upstream was the largest driver of FY20 capex at $7.3bn decreasing from $10.2bn in FY19. Integrated Gas capex has been relatively steady at ~$3-4 bn from FY17. Oil Products capex declined from ~$5bn in FY19 to $3.3bn in FY20. Chemicals capex was lowest at $2.6bn. Current capex on the Renewable and Energy Solution business is not disclosed.
In the near-term, RDS anticipates total cash capex of between $19-22bn (1H21 was $8.4bn). The chart below summarises RDS' guidance of capex by division, which at the upper range is a total of $23bn. Upstream will continue to be the key driver of RDS capex at $8bn (80% to be spent on its core positions). Chemicals capex is forecasted to increase to $5bn as the segment is repositioned and further integrated with Oil refineries. Oil Products $3bn and Integrated Gas $4bn in capex are largely unchanged, and Renewables and Energy Solutions capex is expected to be $3bn. While RDS has not provided details on where renewables capex will be spent, we expect a significant investment will be required for hydrogen in order to meet market share targets. We expect less capex will be needed in renewable generation than peers. Additionally, as RDS' strategy is also driven by distribution, we anticipate an increase in operating expenditure for Marketing and Renewables in the next 5 years.
We do not yet have sufficient detail from RDS to determine if it has the financial capacity to execute its climate transition plans and will be monitoring this closely. We see high costs associated with CCUS (carbon capture utilisation and storage, Gorgon cost ~$2.4bn[2] to date), LNG expansion and hydrogen production.
Chart: RDS Cash Capex by segment (US$bn), FY17 to FY20, and RDS guidance
Source: Company data, Global Climate Insights estimates
In 2Q21, RDS achieved its target to reduce Net Debt to $65bn. This was a condition set by management in order to increase the dividend, and set as a target to ensure it maintains its A+ credit rating. RDS' debt maturity profile appears diversified, as at FY20 $13bn of its $80bn debt (16%) was due to mature in the next year, $23bn (30%) in the following four years, and the remaining $42bn (54%) due 5 years and later.
Chart: RDS Net debt (US$bn) and gearing (%), FY17 to FY20
RDS is targeting net debt below $65bn in order to maintain its A+ credit rating
Source: Company data, Global Climate Insights estimates
In FY20, decommissioning and other provisions were ~$31bn, equating to ~15% of total PPE and ~8% of total assets. This increased by $5.5bn from FY19 (10% of total PPE), the value of which is impacted by project assumptions and discount rates (1.75% in FY20). RDS expects ~$6.1bn of its provision to be used in the next 10 years (~20%).
Chart: RDS Decommissioning provision (US$bn), FY17 to FY20
As decarbonisation accelerates, decommissioning provisions are likely to increase
Source: Company data, Global Climate Insights estimates
From FY22, RDS will report under five key segments (ex-Corporate) aligning with its new strategy. By applying FY20 adjusted earnings, we can assess the materiality of these new segments:
The segments will be further aggregated into three key pillars:
Diagram: RDS segment restructure, FY20 Adjusted Earnings (excludes corporate, US$bn)
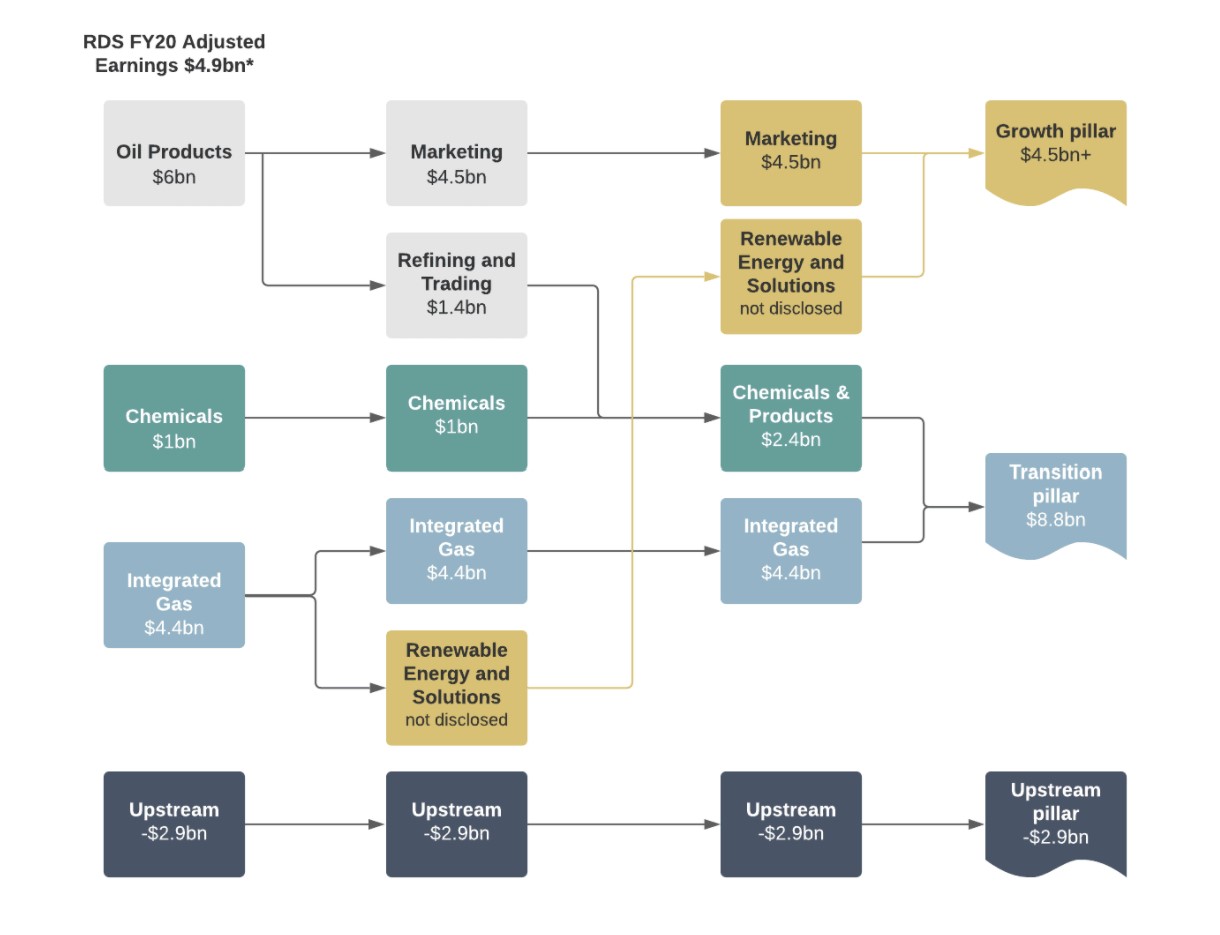
Source: Company data, Global Climate Insights estimates. * Adjusted Earnings includes all segments excluding corporate.
Integrated Gas reflects the earnings from: natural gas exploration and extraction, production of Liquefied-Natural-Gas and Gas-to-Liquids, midstream infrastructure (pipelines, shipping, storage), sale and trading of gas products and electricity, and the Renewables and Energy Solutions business.
RDS is the largest seller of LNG globally (70Mt sales in FY20), one of the largest LNG shipping operators (owning and having access to around 20% of the world's LNG shipping fleet[3]), and one of the largest Gas-To-Liquids producers.
As RDS does not disclose the materiality of earnings from its Renewables and Energy Solutions business, our comments on the decarbonisation outlook relate largely to its gas business. We have included detailed analysis of lower-carbon fuels in part 1 of our RDS report.
In FY20, Integrated Gas delivered Adjusted Earnings of $4,383m, -51% compared to FY19. Including one-offs, earnings were -$6,278m. The key driver was impairments of $12,221m pre-tax ($9,282m post-tax), and lower volumes of LNG sales (-6%) and liquefaction (-6.5%). Production of oil and gas was broadly unchanged at 911 k boe/d. However, this includes the net impact of lower volumes from the Prelude Floating LNG and Gorgon projects due to maintenance, transfers of production from Upstream and new fields.
Integrated Gas is RDS' second largest segment and accounts for ~30% of capital employed, yielding a RoACE in FY20 of 5%, down from 10% in FY19. RDS is targeting a 20% decline in operating expenditure in FY22.
From FY22 the segment will be split, with the Renewables and Energies business being reported separately. By 2050, RDS expects the majority of its fuels to be low-emissions, with any remaining fossil fuels using carbon capture utilisation and storage (CCUS) or carbon offsets.
Chart: Integrated Gas Adjusted Earnings (US$bn), RoACE (%, Adjusted Earnings) and Profit Margin (%). FY17 to FY20
Integrated Gas RoACE (%) has averaged 5-11%
Source: Company data, Global Climate Insights estimates
Chart: Integrated Gas organic free cash flow (US$bn), % of RDS Group (RHS)
Integrated Gas cash generation has varied over the last four years
Chart: Integrated Oil and Gas production (thousands b/d)
Integrated Gas production of Oil and Gas declined 1% in FY20
Chart: Integrated Gas LNG sales (Million Tonnes per annum)
Total LNG sales declined 6% in FY20 to ~70Mt, in FY19 sales increased 5%
Source: Company data, Global Climate Insights estimates
RDS has 26,114,000 million standard cubic feet of natural gas reserves at FY20 - equivalent to ~548 Mt LNG, or ~4.5 billion boe. Australia is RDS’ largest gas producing region - contributing 19% to total - followed by Asia, USA and Malaysia. The top 10 regions account for ~80% of total reserves.
RDS' largest Integrated Gas assets are its LNG fields in the North-West Shelf (16.4 Mt p.a,[10] 16.67% equity stake), its LNG Plant Prelude FLNG (5.3 Mt p.a,[11] 67.5% equity stake), and its GTL Plant Pearl in Qatar (12.2 Mt p.a,[12] DPSA with the State of Qatar).
Map: Location of RDS Gas Assets 2Q21
Source: Company data, Global Climate Insights
The Upstream segment includes the exploration of oil, natural gas, and natural gas liquids, along with the trading and sale of crude oil and natural gas. Upstream owns pipelines to deliver oil and gas to customers.
In FY20, Upstream Adjusted Earnings were -$2,852m, a $7,304m decline on FY19.
FY20 production declined 10% on FY19; -4% from oil and gas liquids, and -19% from natural gas. Natural gas production was impacted by ongoing issues at RDS' joint venture, Nederlandse Aardolie Maatschappij B.V. (NAM), of which RDS owns a 50% stake. This was underpinned by an order from the Netherlands Government to decrease and to cease production of the Groningen field by 2022, of which NAM owns a 60% stake. FY19 Groningen field production was 17.5 billion cubic metres, with 5.25 billion cubic metres allotted to RDS (29% of RDS’ own FY19 gas production). Groningen production halved to 8.7 billion cubic meters in FY20. Across Upstream the average realised price of oil in FY20 was $37 per barrel, vs $58 in FY19.
FY20 impairments were large at $8,697m pre-tax ($6,447m post-tax), driven by;
FY20 cash capex was $7.3bn, and is expected to be $8bn in FY21. RDS targets US$7-9bn p.a in capex for Upstream, with the exploration budget accounting for $1.5bn.
Chart: Upstream Adjusted Earnings (US$bn), RoACE (%) and Profit Margin (%). FY17 to FY20
Upstream adjusted earnings were -$2.9bn in FY20, a large decline from FY19 earnings of $4.5bn
In FY17 to FY19 RoACE (%) has averaged 5%
Chart: Upstream organic free cash flow (US$bn), % of RDS Group (RHS)
Organic free cash flow was positive in FY20, but reduced 60% from FY19 to $4bn
Chart: Upstream production (thousands b/d)
Upstream oil and gas production declined 10% on FY19 to 2.4 million tonnes of barrels per day
Source: Company data, Global Climate Insights estimates
The current project pipeline for Upstream includes over 1,200 thousand boe/d of additional capacity (half of Upstream’s current production). The average break-even price for pre-FID projects is $30 boe with a payback period of 7 years.
We note that RDS recently announced the sale of its assets in the Permian Basin to ConocoPhillips. The transition is expected to be complete in 4Q21. We will assess the impact on emissions forecast post-completion in 4Q21.
Map: Location of RDS Upstream Core Assets 2Q21
Source: Company data, Global Climate Insights
The Oil Products segment is divided into two key businesses: Refining, Trading and Supply (this will move to RDS' new Chemicals and Products business), and Marketing, its retail and distribution business (this will be a standalone segment going forward). RDS has trading offices in Houston, Rotterdam, London, Singapore, and is the largest global trader of physical crude and energy products. RDS is the largest seller of lubricants globally.[17]
Oil Products Adjusted Earnings was $5,955m, a decline of 4% on FY19.
In FY20, the Refining, Trading and Supply business contributed $1,425m, ~25% of the Oil Products Adjusted Earnings. The business refines oil products and produces synthetic crude oil and bitumen (from oil sands) with inputs from RDS' upstream business, and trades and supplies crude oil, refined products, chemical feedstocks, and sale of carbon credit to customers. The Trading and Supply business deals in both RDS and third-party products, and sells products to RDS' Oil Products Marketing business.
In FY20, the Marketing business contributed $4,570m, ~75% of the Oil Products Adjusted Earnings. This is RDS' key distribution business and the centre of its transformation strategy. RDS has 6,000 km of pipelines (with access to an additional 14,000km of non-operated businesses). The segment also includes the Shell Sulphur Solutions business, that refines and markets sulphur for use in fertiliser, mining and chemicals.
The largest part of Marketing earnings is derived from RDS' Retail business, which contributed ~50% of Marketing's earnings in FY20. Lubricants contributed ~30% to Marketing earnings. The remaining 20% of earnings stems from sales to commercial customers including aviation, shipping, transportation and industry. In 1H21, Marketing produced one of the strongest quarterly results in the last decade given margin management and a growing footprint.
Chart: Oil Products Adjusted Earnings (US$bn), RoACE (%, RHS) and Profit Margin (%, RHS). FY17-FY20
Adjusted earnings were ~$6bn in FY20, a decline of 4% on FY19
RoACE (%) has averaged 14% in the last four years
Chart: Oil Products organic free cash flow (US$bn), % of RDS Group (RHS)
FY20 organic free cash flow was ~$7.6bn, the highest of RDS’ segments
Chart: Oil Products Sales (thousands b/d)
Oil products sales declined 28% in FY20, impacted by COVID-19
Gasoline remains the largest contributor at ~37%
Source: Company data, Global Climate Insights estimates
RDS' Chemicals business refines and sells base chemicals (ethylene, propylene, benzene, ammonia and methanol) to be used in further manufacturing processes, as well as intermediate chemicals (solvents, styrene, olefins). The largest driver of Chemicals end-use is plastics, rubber and fibres (~40%) and fertiliser (~30%, ammonia and urea).[22]
The Chemicals segment has been undergoing a transformation over the last three years, as lower margins from increased capacity in the Middle East and Asia[23] have decreased profitability. RDS has rationalised its chemical plants and divested assets, including its 50% interest in Deer Park refinery (due to complete in 4Q21 for $2.5bn) and Puget sound refinery (to complete in 4Q21 for $350m).[24]
Using Scope 1 and 2 emissions disclosed for RDS’ Downstream business, we estimate the Chemicals segment Scope 1 and 2 for FY20 at 14.6 Mt; down from 15.8 Mt in FY19. Currently RDS reports Chemical intensity for GHG emissions per tonne of production. As at FY20, this was 0.98 CO2e/tonne, lower than FY19 but broadly in line with FY16.
In FY20 the Chemical segment Adjusted Earnings were $962m, 30% higher than FY19, although substantially lower than the $2,076m reported in FY18. The Return on Average Capital in FY20 was 4.4% and Profit Margin 6.4%. This segment is RDS' smallest, contributing 4% to Group Adjusted Earnings in FY19 and 11% in FY20.
In FY20, RDS sold 15,036 thousand tonnes of product to 1,000 industrial customers, equally split between base and intermediate chemicals. RDS is seeking to increase its share of intermediate and performance chemicals, given the more specialised nature of production and the higher margins.
Chart: Chemicals Adjusted Earnings (US$bn), RoACE (%, RHS) and Profit Margin (%, RHS). FY17 to FY20
Adjusted earnings for chemicals have declined in the last two years due to divestments and weaker industry margins
The Return on Average Capital in FY20 was 4.4% and Profit Margin 6.4%
Chart: Chemicals organic free cash flow (US$bn) and % of RDS Group (RHS)
Chemicals organic cash flow has been low/negative over the last three years
Chart: Chemical product sales (thousands tonnes p.a)
Sales have declined in the last four years, impacted by divestments
The portion of intermediate chemicals has increased
Source: Company data, Global Climate Insights estimates
The figure below shows RDS’ five integrated energy chemical parks (Pernis, Scotford, Pulau, Norco, Rheinland), excluding Deer Park refinery, with the divestment due to be completed in 4Q21. RDS has an additional five chemical-only sites. This footprint has been reduced from the 14 refineries held in FY20 and 54 in FY04.
Map: Location of RDS Integrated Energy and Chemical Parks 2Q21*
Source: Company data. * Excludes Deer Park refinery sale which is to be completed in 4Q21.
Initiation of coverage, Part 2: Royal Dutch Shell in a decarbonised economy | October 2021
Please read the terms and conditions attached to the use of this site.
Saygin, D et al (2021) https://doi.org/10.3390/en14133772. ↩︎
Bloomberg Finance L.P. ↩︎
Royal Dutch Shell (2021) Liquified natural gas (LNG) ↩︎
Royal Dutch Shell (2021), Enhanced Quarterly Disclosures ↩︎
IEA (2021) Net zero by 2050: A roadmap for the global energy sector. ↩︎
Bloomberg Finance L.P. ↩︎
see above, 5. ↩︎
RDS (2021), LNG Outlook - page 11, Wood Mackenzie H1 2020 data ↩︎
see above, 5 ↩︎
Bloomberg Finance L.P. ↩︎
Royal Dutch Shell (2019) Prelude FLNG. ↩︎
Royal Dutch Shell Pearl GTL - Overview. ↩︎
see above, 5., Annex A. ↩︎
see above, 5., Figure 2.18. ↩︎
see above, 5., Figure 2.7. ↩︎
see above, 5. ↩︎
Kline & Company (2020) Global Lubricants: Market Analysis and Assessment 2020. ↩︎
see above, 5. ↩︎
see above, 5., figure 2.5. ↩︎
Electric & hybrid (2020) The new age of lubricants for electric vehicles. ↩︎
see above, 5., page 136. ↩︎
Levi, Peter G. et al (2018) doi: 10.1021/acs.est.7b04573, https://pubs.acs.org/doi/10.1021/acs.est.7b04573. ↩︎
IHS Markit (2021) Petrochemical capacity in China and Middle East: Growth amid challenges. ↩︎
ScienceDirect (2015) Petrochemical industry. ↩︎
IEA (2018) The future of petrochemicals. ↩︎
IEA (2021) Net zero by 2050: A roadmap for the global energy sector. ↩︎
IEA (2020), Chemicals, IEA, Paris ↩︎
see above, 5., figure 2.19. ↩︎
see above, 5. ↩︎
UK Government (2021) Introduction of Plastic Packaging Tax from April 2022. ↩︎
European Commission (2020) A new Circular Economy Action Plan For a cleaner and more competitive Europe. ↩︎
APCO, Australia’s 2025 national packaging target; Woolworths Group, Our sustainability plan 2025 and Thomas Parker (2020) How 2020 became the year when supermarkets changed their packaging policies. ↩︎
Get email updates about new ACCR research and shareholder advocacy on specific topics of interest to you.
Sign Up