25th March 2022
Publication Information
Download Publication
- 2 MB PDF
- 25th March 2022
Stay Informed
Get email updates about new ACCR research and shareholder advocacy on specific topics of interest to you.
Sign UpIn this note we look at the climate transition plans of BP Plc (BP), which along with Shell Plc (Shell) and TotalEnergies are the largest European Integrated Oil and Gas (IOC) companies. Like Shell, BP is looking to reposition itself as an Integrated Energy Company (IEC) with diversified revenue streams outside of its emissions-intensive businesses. By FY30 BP expects to deliver $41-48bn in EBITDA, with $9-10bn (~21% of BP group) from its transition growth businesses (bioenergy, convenience, electric vehicle (EV) charging, renewables and hydrogen), up from the ~$1.5bn (4% of BP group) in FY21.
While BP’s earnings guidance appears ambitious, implying a ~23% CAGR in its transition business EBITDA, its strategy will not reduce GHG emissions. As we looked closer at BP’s business we found that BP discloses only a fraction (~41%) of the GHG emissions attributable to the products it sells. BP’s only material lever for delivering emission reduction in the next 8 years (reduced oil and gas production) is unlikely to drive real world emissions reduction, with the company confirming at its 4Q21 result that any production decline from FY21 to FY30 will be driven by divestments.
The question for investors is, what is driving the disconnect between BP’s increasing emissions and its growth aspirations for its low-carbon business? Is BP favouring optionality in its strategy, at the expense of climate?
Table: BP EBITDA and GHG emissions contribution, FY21 (actual) and FY30 (guidance/GCI forecast)
| Transition business | Oil and Gas business | |||||||||
|---|---|---|---|---|---|---|---|---|---|---|
| Contribution | % split | Contribution | % split | |||||||
| FY21 | FY30 | CAGR | FY21 | FY30 | FY21 | FY30 | CAGR | FY21 | FY30 | |
| EBITDA | ~$1.5bn[1] | $9-10bn | 22-23% | 4% | ~21% | $35.7bn | $32-38bn | -1% to 1% | 96% | ~79% |
| Capex p.a.[2] | ~$3.1bn[3] | $7-8bn | 9-11% | 25% | ~50% | $9.3bn[4] | $7-8bn | -3 to -2% | 75% | ~50% |
| Emissions[5] Mt CO2e | 42 | 85 | 8% | 2% | 3% | 2,113 | 2,344 | 1% | 98% | 97% |
| Divested assets Mt CO2e | n/a | n/a | n/a | n/a | n/a | 38 | 153 | 17% | 100% | 100% |
Source: Company data (p. 18 4Q21 results presentation), Global Climate Insights estimates. Based on Brent $60/bbl. $3/mmbtu Henry Hub. Oil and gas EBITDA includes Rosneft in FY21. Rosneft is excluded from GHG emissions.
We exclude BP’s share of Rosneft from our BP GHG emissions forecast, following the decision in February to write down and ultimately exit its holding in Rosneft. Where it makes sense to do so, we add back BP’s share of Rosneft when comparing historical emissions prior to FY21, and state clearly where this is the case.
BP is holding an advisory vote on its ‘net zero’ report at its AGM in May 2022. This will be BP's first climate vote. We advise investors to keep it simple. Step away from the noise of net zero and 1.5°C by 2050, which the current management teams will not be responsible for delivering, and seek to understand what plans are in place to reduce absolute emissions across the business between now and FY30. As it currently stands, the complexity of BP’s plan makes this far too onerous for investors. BP is putting forward 20 Aims, each with unique caveats and carve-outs. Investors should request a simple group-wide commitment and plan on absolute emissions reduction by FY30, with the scope of emissions reflecting all material businesses that drive earnings, along with a commitment to measure emissions where data is unavailable.
In this note, we also assess BP’s climate plan in comparison to Shell. Excluding Rosneft production, BP is a smaller business than Shell in most respects. Shell’s market capitalisation, ~US$208bn, is almost twice that of BP's, ~US$100bn. In FY21 BP’s adjusted profit (post-tax) was $13.7bn, ~29% smaller than Shell’s at $19.3bn. BP’s oil production is ~16% higher than Shell’s (including Rosneft) and gas production ~11% smaller. BP’s reported emissions are 37% smaller than Shell, but we believe this excludes a material proportion of GHG emissions from sold products, with BP’s total GHG emissions being closer to 2,329 MtCO2e. This difference between Shell and BP requires further analysis to understand if Shell’s emissions include all sales of oil and gas products. We hope this analysis is a useful tool and prompts some interesting questions in considering BP’s climate transition strategy.
Table: BP and Shell relative size FY21
| BP | Shell | BP relative size | |
|---|---|---|---|
| Market cap (US$bn, 23/03/22) | 99.7 | 208.1 | 52% smaller |
| Underlying profit FY21 (US$m) | 13,737 | 19,289[6] | 29% smaller |
| Oil production incl. Rosneft (kboe/d) | 1,951[7] | 1,685 | ~16% larger |
| Own gas production incl. Rosneft (kboe/d) | 1,329 | 1,498 | ~11% smaller |
| Own oil production ex. Rosneft (kboe/d) | 1,091 | 1,685 | ~35% smaller |
| Own gas production ex. Rosneft (kboe/d) | 1,091 | 1,498 | ~27% smaller |
| Reported emissions FY20 (MtCO2e) | 872 | 1,384 | ~37% smaller |
| Estimated emissions from sold products FY20 incl. Rosneft (MtCO2e) | 2,329 | 1,384 | ~68% larger |
Source: Company data, Global Climate Insights estimates
BP will soon release its FY21 sustainability report. We expect it to add additional disclosures to its GHG emissions, reflecting the inclusion of trading sales (oil and gas sales to intermediaries) in its carbon intensity emission reduction target.
At a company level, emissions profiles reflect the quantity of global emissions that a company can influence through their decision making. Therefore, full disclosure of total emissions of a company is the first and most crucial step of a sound climate plan. This implies a full understanding of the company’s scope 1 and 2 emissions and scope 3 emissions of all products that are sold by the company. Scope 3 emissions arise from energy products that an oil company markets, either from its own production or through third-party sales. Scope 3 also includes emissions from traded refined oil product sales, traded gas sales and traded unrefined crude oil sales. BP has also included the lifecycle emissions (including scope 3) from its physically traded products in its carbon intensity targets (Aim 3).
The total GHG emissions disclosed by BP was 991 MtCO2e in FY19; this relates to the lifecycle emissions of BP’s ‘marketed’ energy products.[8] Implicit within BP’s market emissions of energy products is BP’s scope 1 and 2 emissions, scope 3 emissions from BP’s upstream oil and gas production, and scope 3 emissions from sales of marketed third-party oil and gas products. In our analysis of BP’s GHG emissions we have sought to quantify the total GHG emissions attributable to the products that BP sells. This includes estimated emissions for ‘traded sales’ for oil and gas (estimated as 642 MtCO2e for oil and ~367 MtCO2e for gas)[9], and 429 MtCO2e for crude oil sales. On these assumptions, we estimate BP had total GHG emissions from sold products of 2,429 MtCO2e in FY19, more than double its current disclosure.
Chart: BP total FY19 emissions from sold products ex. Rosneft (MtCO2e)
To estimate the additional emissions for FY19 we have used sales volumes disclosed by BP in its annual report and guidance provided in its 4Q21 earnings call.
In 2020 BP set out its strategy to transform from an International Oil and Gas Company to an Integrated Energy Company. It is one of the few majors to quantify what its strategy might deliver in segment earnings, with its transition business expected to account for 20% of EBITDA by FY30.
This is not the first time BP has put forward a transformation agenda. In 2005 it launched BP Alternative Energy, investing over $7bn, developing a large solar business (1,700 employees), onshore wind construction (0.7GW) and establishing its Brazilian ethanol JV. Most of this was written off post-2010. BP at that time was investing in a nascent market, building and operating assets. This time it is different. Nearly two decades later, the pathway to a transformative new energy system is clearer than ever, with global policy and investor support.
However, the BP we see today is a company trying to do it all: “performing while transforming”. We think this could be undermining its ability to set clear emission reduction targets that deliver reducing emissions. We wonder, is BP's investment in low-carbon energy being held back by its past?
Table: Overview of BP’s strategic phases
| Launch BP Alternative Energy | Consolidate | Partnerships and reposition | Low carbon options |
|---|---|---|---|
| 2005-2009 | 2010-2016 | 2017-2019 | 2020 + |
| Creating a new market for low-carbon power. Building, acquiring and operating. | Shedding investments to focus on the core business. | Oil and gas expansion. Investment in Lightsource. | Solutions for the energy transition. Non-operating partnerships in the wind. |
| CEOs: 1995-2007 John Browne 2007–2010 Tony Hayward | CEO: 2010-2020 Bob Dudley | CEO: 2010-2020 Bob Dudley | CEO Feb 2020 onwards: Bernard Looney |
| $8bn spend planned over next 10 years (~$14bn inflation-adjusted). BP invested $7bn by 2011 | $10bn impairment of low-carbon assets by 2010[10] | $200m investment stake in Lightsource | Transition business capex. By FY30 $7-8bn (of which low carbon fuels $4-6bn) |
| 2009 position: Wind 0.7GW Solar 0.2 GW One of the top biofuel blenders/marketers Ethanol JV Brazil Feasibility of Hydrogen with CCUS for power | Gulf of Mexico oil spill (2010) Divests 47% stake in Vivergo Fuels (Ethanol, 2015) | Acquired 43% stake in Solar developer Lightsource Increase stake in Lightsource to 50% and rebrand “Lightsource BP” | Oil and gas divestments Renewable generation Power distribution (including EV charging) Hydrogen Bioenergy Rosneft exit and impairment |
Source: Company data, Global Climate Insights estimates
BP has three strategic pillars under its strategy: resilient hydrocarbons, convenience and mobility, and low carbon energy. The resilient hydrocarbon pillar includes BP’s own oil and gas production, sales of refined products, bioenergy, and gas marketing and trading. We note that the inclusion of bioenergy and gas trading as part of this pillar appears to be recent, and not as previously disclosed in FY20.
Through this strategy BP is seeking to minimise the risk of stranded assets by divesting lower-margin/ higher-cost production assets. Despite lower oil and gas production BP has stated it will “sustain EBITDA from resilient hydrocarbons at around $33bn a year to FY25 and aims to maintain it in a $30-35bn range to FY30”. This is likely driven by continuation of earnings from its trading sales, crude oil and third-party refined products, as well as helped by elevated oil and gas prices.
Under its strategy, BP has committed to decrease its own oil and gas production by 40% by FY30 and is decreasing refining throughput ~30% over the same period. As BP is decreasing the size of its oil and gas production through divestment, there will be limited benefit to GHG emissions as these assets continue to produce (explored more in section 2.2). This strategy will only be beneficial for GHG emissions if driven by the run-off of assets and migration of customers to low carbon energy sources. BP has indicated that despite any decreases in upstream scope 3 emissions, expansion of marketed third-party oil and gas sales in growth markets will lead to an increase in overall marketed emissions. BP must target an overall decrease in total company emissions to effectively decarbonise. The net impact of its growth aspirations in marketed third-party oil and gas, as well as its undisclosed intentions for future sales of traded energy products and unrefined crude oil, will ultimately determine BP’s overall GHG emissions profile and its alignment with a 1.5°C pathway.
Table: Resilient hydrocarbons (expected volume change FY20 to FY30)
| Oil production and operations | Customers and Products | Gas and Low Carbon energy |
|---|---|---|
| Oil production ↓ 40% | Refining ↓ 30% Oil product sales in growth markets ↑ Crude sales - outlook unknown Bioenergy ↑ | Gas production ↓ 40% Gas sales and trading ↑ LNG ↑ 50% |
Source: Company data. Global Climate Insights estimates.
BP aims to reduce absolute GHG emissions for scope 1 and 2 by 27.2 MtCO2e (50% from an FY19 base) by FY30. We expect 42% to come from production decline (including divestment) leaving only 8% for efficiency measures, including any benefit from BP’s lower-carbon assets. For this strategy to have clear benefits on emissions reduction, BP needs to provide a more concrete plan on how it will reduce its scope 1 and 2 for oil and gas assets that it will continue to own.
The focus on lower-cost assets that increase returns will likely place BP at a competitive advantage compared to higher-cost players. The lower-cost asset could also increase the excess profits that could be available for financing transition, although without a clear link between investment in transition and divestment proceeds the benefit may be limited.
Additional financial targets that BP has set for its oil and gas assets include:
Through a climate lens, we view a shorter payback period and a lower reserves to production ratio as a good development, in order to manage stranded assets through the transition. In the last decade, BP’s reserve to production ratio (excluding Rosneft) has declined from 14 years to just over 10 years. However, the reserves to production ratio needs to decrease further over time and reserves decline through divestments needs to be limited, to ensure reserves stay in the ground.
In 2019, BP announced that it would target divestments of $10bn by the end of FY20, and has since committed to $25bn of divestments between 2H20 and FY25. At its 4Q21 result, BP stated that it had received proceeds of $12.8bn out of its target of $25bn in divestments ($15.5bn completed or agreed), with $7.6bn of proceeds received in FY21 and $2-3bn expected for FY22.[12] BP has stated that its divestments will help it to finance its transition business, however surplus cash is currently used to repay debt (40% of surplus) and fund share buybacks (60%). In FY21 BP announced ~$4.9bn in buybacks compared to surplus cash of $6.3bn.
BP’s divestment strategy is an unusual one. Its strategy originally appears to have been driven by increasing margins and divesting low-return assets, but has evolved to become a key pillar of its emissions reduction strategy (Aim 2, scope 3 for own oil and gas production). By the release of BP’s 2020 Sustainability Report (March 2021), its 40% reduction in oil and gas production was a key driver of reducing absolute emissions.
Here is what we know:
If we assume 0.2m boe/d of BP’s reduction in production since FY19 has come from decline in reservoirs, it would mean the remaining 0.9m boe/d or ~80% of its target would be driven by divestments. We have been very generous in this assumption and it is possible 100% of decline is from divestments.
Our work is here to answer how oil and gas companies are aligning their strategies with a 1.5°C pathway. For this purpose, we believe that divestment strategies are not decarbonisation strategies and can not be a material driver (greater than 10%) of GHG emissions reductions in a company plan, given real-world emissions will continue to increase. Annual disclosure of scope 1-3 GHG emissions from divested assets is necessary for investors to build a complete picture of BP’s emissions performance, along with a commitment to invest a percentage of proceeds from divestment into transition.
In the table below we look at some of the oil and gas assets BP has divested to understand how emissions may change post divestment. The assets we have looked at account for around 80 kb/d oil, 0.3 bscf/d gas and 13 kb/d condensate production, or 6.5% of overall production, equivalent to 30 Mt CO2e p.a.[13] Of the assets listed below, there are no transactions where we believe emissions are likely to decline.[14]
Divested assets will continue to generate emissions, potentially at a higher rate if production is increased by the new operator. There are also additional environmental risks, in particular around decommissioning, when assets are acquired by less safety-conscious operators. In addition, BP will start up new oil and gas projects (e.g. Mad Dog Phase 2 in the Gulf of Mexico, Eagle Ford expansion onshore US, Tangguh expansion in Indonesia and BP’s aim to increase in LNG production) which will result in an increase in overall emissions in the coming years. This is inconsistent with the necessary decline in hydrocarbon production projections that are aligned with the 1.5°C Paris agreement. Under the IEA Net-Zero emissions scenario (IEA NZS)[15] there is a 21% decline in oil production and a 4.5% decline in gas production between 2020 and 2030.
To assess the merits of BP’s divestments it should include in its disclosures:
At this stage, BP’s justification for commissioning new fossil fuel projects while divesting assets with a stable production appears counterproductive for global emissions. The total emissions of the divested and new assets together do not decrease and this implies oil and gas assets are not decarbonising.
Table: BP’s key oil and gas divestments 2019 to 2021[16]
| Asset | Buyer | Country/ Region | Estimate oil and gas production (BP share) | Estimate value | Status/ date |
|---|---|---|---|---|---|
| Gulf of Suez oil concession | Dragon Oil (sub. Emirates National Oil Company) | Egypt | ~57 kboe/d (BP share 50%, ~29 kboe/d) | U$500m | Complete 2020 |
| Prudhoe bay (BP Exploration Alaska) | Hilcorp Energy Co (US Private oil company) | United States | ~180 kb/d oil (BP share 26.4%, ~47 kboe/d) | US$5,600m | Complete 2020 |
| Shearwater | Shell | North Sea | 18 kb/d oil (BP share 27.5%, ~5 kboe/d) | Estimate at ~US$625m | Complete 2021 |
| Wahoo and Itaipu deep water oil fields (BM-C-30 and BM-C-32) | Petro Rio SA (listed Brazilian oil company) | Brazil | No production (BP share 35.7% Wahoo, 60% Itaipu) | US$100m | Complete 2020 |
| Shallow Water Absheron Peninsula | LUKOIL PJSC (Listed Russian energy company) | Azerbaijan | Exploration only | Not disclosed | Complete 2021 |
| Block 61 (partial divestment, bp retains 40% share) | PTT Exploration and Production PCL (State-owned Thai oil company) | Oman | 1.5 bcf/d gas, 65 kboe/d condensate (BP share 20%, 0.3 bcf/d, 13 kb/d condensate) | US$2,450m | Complete 2021 |
| Total | 143 kboe/d | ~$9.2bn |
Source: Company data, Bloomberg Finance L.P., Global Climate Insights estimates
BP originally considered divesting its oil and gas assets in Angola but have instead combined them in a joint venture with ENI (more than 200 kboe/d)[17] and will raise external capital, which is another way BP will be able to free up capital.[18]
Assets we believe may be considered for divestment include:
Other potential assets that have been reported as being up for divestment[21]:
In FY20, Shell produced almost 30% more oil and gas than BP (excluding Rosneft), sold 7 times the amount of biofuels on an ethanol equivalent basis, and nearly tripled electricity sold. In contrast, BP displays a greater capacity in renewables generation.
BP’s FY20 oil production is ~20% larger when including production from its 19.75% stake in Rosneft. However, this is not representative of BP’s future company profile following the company’s intention to divest this part of the business. When comparing overall sales of oil products, BP reports significantly larger volumes (~60%). This is also the case when contrasting overall sales of gas products, where BP sales are 36% larger than Shell’s when including volumes implied from traded energy products.
Table: FY20 Business Profile
| BP | Shell | BP relative position | |
|---|---|---|---|
| Oil production (ex. Rosneft) | 1,229 kboe/d | 1,752 kboe/d | ~30% smaller |
| Oil production (incl. Rosneft) | 2,106 kboe/d | 1,752 kboe/d | ~20% larger |
| Gas production (ex. Rosneft) | 1,109 kboe/d | 1,533 kboe/d | ~28% smaller |
| Gas production (incl. Rosneft) | 1,330 kboe/d | 1,533 kboe/d | ~13% smaller |
| Oil product sales (refined products, crude oil, third-party) | 7,698 kboe/d | 4,710 kboe/d | ~60% larger |
| Gas product sales (natural gas, LNG, third-party) | 2,385 (~4,465 kboe/d incl. implied traded sales) | 3,277 kboe/d | ~36% larger |
| Renewable energy operating capacity | 1.5 GW | 1.4 GW | ~7% larger |
| Hydrogen generation - Gas | 0.6Mt[24] used in operations | 0.33 Mt | ~80% larger (market size small for both) |
| Hydrogen generation - Renewable | n/a | 1.3 kt | BP smaller |
| Bioenergy (ethanol equivalent production) | 20.3 kb/d | 142 kb/d | ~86% smaller |
| Power delivered | 214 TWh | 613 TWh | ~65% smaller |
| EV infrastructure | 13,100 charging points | 60,000 charging points | ~78% smaller |
| Retail outlets | 20,500 | 46,000 | ~55% smaller |
Source: Company data. Global Climate Insights estimates
Both BP and Shell have set similar carbon intensity reduction targets of up to -20% by FY30.
Table: BP compared to Shell aspirations FY20 to FY30
| BP | Shell | BP relative position | |
|---|---|---|---|
| Carbon intensity reduction target | 15-20% | 20% | Similar intensity reduction range |
| Carbon Capture and Storage | No target. A “strategically important” area to achieve aims. | 25 Mt by FY35 (estimated 11 Mt by 2030) | BP is not reliant on CCUS to achieve its FY30 target |
| Offsets | No target. Will be used to meet regulatory and customer requirements. BP does not intend to rely on offsets to meet its net zero targets or aims out to 2030. | 120 Mt | BP is not reliant on offsets to achieve its FY30 target |
| Investment in “transition” | Transition spend will be 40% of total capex by FY25 ($5.6-$6.4bn p.a.) and 50% of capex by FY30 ($7-8bn p.a.) | FY22: Capex from Renewables and Energy Solutions ~$3bn and Marketing $5-6bn capex (~34% of group) By FY25, 50% of total spend (capex and opex) is expected to be driving the energy transition | Total spend appears smaller than Shell in dollars, but higher relative to group capex |
| Earnings from “transition” | $9-10bn by FY30 | Not disclosed | BP is the first major to disclose forecast earnings for transition |
| Capital allocation to “transition” | At least 20% of group capital employed by FY25 | Not disclosed | BP is the first major to disclose forecast capital for transition |
| “transition” businesses | Bioenergy, convenience (retail network), EV charging, renewables, hydrogen | EV charging, low carbon fuels (SAF, biodiesel, renewable gas), renewables, energy solutions, and non-energy products (lubricants, chemicals, convenience, retail) | |
| Oil production | 40% reduction on FY19 (average 4.5% p.a. to FY30) (reduction of 492 kboe/d) | 1-2% decline p.a. from FY19 onwards (reduction of 349 kboe/d) | BP decline to FY30 is driven predominantly by divestments |
| Gas production | 40% reduction on FY19 (average 4.5% p.a. to FY30) (reduction of 444 kboe/d) | Share of gas to increase to 55% of fossil fuel production | As above |
| Oil product sales (refined products, crude oil) | Total oil sales to broadly remain constant 40% reduction in upstream production 30% reduction in downstream refining Third-party likely to increase driven by growth plans in ‘fast-growing markets’ No guidance for ‘traded sales’ and crude oil sales | 1-2% decline p.a. for oil products | Shell has committed to overall decline in oil product sales of ~24% by FY30 (includes divestments), BP has not provided guidance on overall oil and gas sales |
| Gas sales (natural gas and LNG) | 40% reduction in upstream production LNG portfolio (liquefaction and third-party): 25 Mt p.a. by FY25 30 Mt p.a. by FY30 FY21 actual: 18Mt | LNG liquefaction: 40 Mt p.a. of LNG by FY25 (+7 Mt p.a. from FY19). LNG portfolio: 95.2 Mt p.a. portfolio in FY21 Share of gas to increase to 55% of fossil fuel production | BP’s LNG portfolio is < 20% the size of Shell, and growth relatively smaller BP does not have guidance for gas sales |
| Renewable energy operating capacity | 50 GW capacity (~639,000 TJ delivered per year) | Delivering >50 m households’ equivalent of renewable power (~900,000 TJ delivered per year) | Shell is focused on delivering power rather than generation. Its aspirations appear larger than BP’s |
| Hydrogen generation - Gas (assume with CCUS) | 10% market share in ‘core markets’ (GCI est. ~0.75 Mt p.a.) | Double-digit market share clean hydrogen (GCI assumes 10%) (GCI est. ~2.5 Mt p.a.) | Shell expected to be larger |
| Hydrogen generation - Renewable | 10% market share in ‘core markets’ (GCI est. ~0.45 Mt p.a.) | Double-digit market share clean hydrogen (GCI assume 10%) (GCI est. ~1.5 Mt p.a.) | Shell expected to be larger |
| Bioenergy | 100 kb/d (ethanol equivalent) | 8x more low-carbon fuels (~1,177 kb/d ethanol equivalent) | Shell larger |
| Power delivered | 500 TWh | Double electricity sold on 2019 (1,053 TWh by FY30) | Shell larger |
Source: Company data. Global Climate Insights estimates.
BP has four GHG emission reduction targets: two are absolute targets (Aim 1 and 2) and two are intensity targets (Aim 3 and 4). We estimate BP’s absolute emission reduction targets (pre-FY50) cover only ~17% of its overall GHG emissions from sold products, giving rise to the risk that increases in the remaining 83% of emissions more than offset any savings. This is before taking into account the emissions from divested assets that are likely to continue production and contribute to cumulative global emissions. In February this year, BP increased its Aim 1 and Aim 3 targets and expanded the scope of its carbon intensity target (Aim 3) to include ‘physically traded’ sale of energy products (sales to intermediaries).
Chart: BP FY19 GHG emissions and targets
Table: BP Net Zero Aims (announced Feb 2020, updated Feb 2022)
| Aim | Targets | Target type | Base | FY2025 | FY2030 | FY2050 |
|---|---|---|---|---|---|---|
| 1 | Scope 1 and 2 operational | Emissions reduction on FY2019 | 54.4 Mt CO2e | 20% | 50% (prior 30-35%) | 100% |
| 2 | Scope 3 own production of oil and gas | Emissions reduction on FY2019 | 360.6 Mt CO2e | 20% | 35-40% (prior 30-40%) | 100% |
| 3 | Scope 1-3 for marketed and physically traded energy products | Carbon intensity reduction on FY2019 | 78.8 g CO2e/MJ | 5% | 15%-20% (prior 15%) | Net zero (prior 50%) |
| 4 | Methane | Methane intensity | BP will update by 2023 | 0.20% | Timeline for 50% reduction TBC |
Source: Company data, Global Climate Insights estimates
BP does not rely on carbon offsets to reach its FY30 targets, which we see as the right approach. Carbon offsets are likely to play a role in trying to counterbalance emissions that have historically cumulative emissions but they are not a substitute for urgent emissions reductions. With the carbon offset industry very much in its infancy, the quality of offset use has not yet been established. BP has not specified its reliance on CCUS to reach its hydrogen aspirations; from its current disclosure BP appears less reliant on CCUS than Shell. We estimate that to facilitate BP’s blue hydrogen ambitions, up to 9MtCO2 CCUS will be required for FY30 and up to 98 MtCO2 by FY50 (assumes 100% of the carbon is captured, more likely to be 60-95%[25]). This compares to Shell’s FY35 target of 25 MtCO2 of CCUS.
BP’s clear target to reduce oil and gas production by 40% appears ambitious; however, the majority of this reduction is expected to come from the divestment of assets which will likely continue to contribute to global emissions. We estimate these divested assets will continue to contribute in excess of 153 MtCO2e per year globally by FY30 (based on estimated divestments of 0.9m boe/d).
BP has undertaken more work than peers to quantify how the transition of its business model to an energy company will impact its capital employed and earnings. However, we still see a large disconnect between its FY30 earnings aspirations for its transition business and our forecast outcome for FY30 absolute GHG emissions.
Where more work is needed:
Our key concern with BP’s climate strategy is its lack of transparency and targeted reduction in its total GHG emission for products it sells. BP’s emissions reduction targets address discrete aspects of its business, with the scope of GHG emissions under each target very specific to BP. It will be difficult for investors to assess the level of BP’s ambition against alignment with 1.5°C and the outcome of BP’s targets on its total emissions profile.
We were surprised by how material the GHG emissions for BP’s traded oil and gas productions and crude oil sales are to its business, accounting for ~59% of its 2.4GtCO2e, and completely left out of any absolute emission reduction targets pre FY50.
The emissions reduction targets that BP has set are materially reliant on divestment. In section 2.2 above we take a look at some key oil and gas assets that have contributed to BP’s divestments to date, and could not identify assets where production was likely to decline. Like Shell, BP’s alignment with 1.5°C can only be assessed with the setting of FY30 absolute emission reduction targets for all material BP sales (scope 1, 2 and 3).
The table below summarises the changes to BP’s emissions based on the scope of emissions disclosed under each of BP’s aims.
Table: BP’s drivers of emissions reduction FY30
| FY30 GHG emissions reduction material activities disclosed | Emissions reduction (Mt CO2e) | |
|---|---|---|
| Aim 1: 50% reduction of scope 1 and 2 operational emissions | -27.2 required | |
| - | 40% decline in BP oil and gas production on FY19 | -23 (largely divestments) |
| Implied change from efficiency measures include: Reduced methane flaring Purchasing energy from renewable sources Optimising efficiency of upstream/downstream processes | -4.2 | |
| Aim 2: Scope 3* own production of oil and gas (ex Rosneft) | -126.4 to -144.4 required | |
| - | 40% decline in BP oil and gas production on FY19 | -143.8 (largely divestments, less than Aim 3 as BP uses a lower carbon intensity reflecting combustion of unrefined oil and gas) |
| Aim 3: GCI estimate of absolute emissions equivalent of Scope 1-3 for marketed energy products and physically traded energy products (ex Rosneft) | Intensity-based target - absolute emissions may be flat or increase | |
| - | 40% decline in BP oil and gas production on FY19 | -196 (largely divestments) |
| - | LNG portfolio | +38 |
| - | Traded electricity | +32 |
| - | Clean hydrogen | +9 |
| - | Biofuels | +3 |
| No guidance on: Overall oil and gas sales (ie including from third-party, crude sales, traded sales) Reliance on CCUS for hydrogen production | +116 - |
Source: Company data, Global Climate Insights estimates. *Aim 2 scope 3 intensity is based on EPA combustion factors
A core part of our analysis when reviewing company climate transition plans is to construct an emissions forecast based on a company's production ambitions and strategy. The key components of our forecast include carbon intensities for products sold by BP, market share and size assumptions. To allow for meaningful comparisons to our Shell emissions forecasts, we have used Shell’s Sky 1.5 scenario and the IEA NZS for market share assumptions.
As part of reporting under Task Force on Climate-related Financial Disclosures (TCFD), BP released an emissions scenario which it states is consistent with the Paris Agreement’s 1.5°C long-term temperature goal; in the case of BP this is its “net zero scenario”. A new paper published by Brecha et al. (2022) shows that most corporate scenarios are not aligned with the 1.5°C long-term temperature goal.[26] Specifically for BP, the research shows that BP’s net zero scenario is not allowing for sufficiently deep carbon emission mitigation to limit the 1.5°C overshoot. This means that while the scenario achieves the 1.5°C long-term temperature goal, the peak temperature is substantially above 1.5°C above pre-industrial levels.
Investors should be asking companies they invest in to ensure that climate scenarios are robust, and that 1.5C scenarios used to make business plans and test valuations are accurate. We note BP stated in 2020 that it intends to work with the Task Force on Climate-related Financial Disclosures (TCFD) to develop good practices and standards for transparency. TCFD asks companies to disclose the impacts of climate related risks by ‘describing the resilience of the organisation’s strategy, taking into consideration different climate-related scenarios, including a 2°C or lower scenario’, but it does not ask for 1.5°C (or 2°C) alignment, nor does it verify disclosures.[27] Science Based Targets initiative’s (SBTi) Business Ambition for 1.5°C campaign does, but has banned oil and gas companies from joining its accreditation system.[28]
The IPCC has published many peer-reviewed emission mitigation pathways that have been generated by Integrated Assessment Models (IAMs). They all have a certain climate outcome, some of which are aligned with the Paris Agreement’s 1.5°C long-term temperature goal. Most IAMs run over a long-term horizon (to the year 2100) to properly assess whether they align with the 1.5°C long-term temperature goal. There are also various corporate emission mitigation pathways, such as the IEA scenarios, BP’s net zero and rapid scenarios, and Shell’s Sky 1.5 scenario. While Shell’s Sky 1.5 runs until 2100, BP’s net zero scenario ends in 2050. BP’s net zero and Shell’s Sky 1.5 scenario claim to be in line with the 1.5°C long-term temperature goal, but this claim has never been peer-reviewed.
Brecha et al. conclude that only the IEA NZS can be classified as a 1.5°C low overshoot scenario. Its peak warming is 1.56°C and therefore is considered to have ‘low overshoot’ (above the 1.5°C goal). BP’s net zero scenario achieves an end of century warming of 1.5°C, as claimed, but reaches a peak warming of 1.65°C, indicating a high overshoot. Shell’s Sky 1.5 results in a peak warming of 1.81°C warming and is not aligned with 1.5°C at the end of the century.
The chart below illustrates the carbon intensities we have assumed in our analysis. This remains constant throughout the forecast period of FY21 to FY50.
As BP does not have any specific targets for post-emissions compensation technologies, such as CCUS and carbon offsets, these are not included in BP’s GHG emissions forecast.
As illustrated in the table below, the most emission-intensive fuel is hydrogen produced using gas as feedstock at 100 gCO2e/MJ. Any reductions in intensity will be a result of CCUS. Based on current projects/estimates, up to 60% of CO2 could be stored[29], reducing the net carbon intensity to ~46g CO2e/MJ.[30] Depending on the actual carbon stored in the production of hydrogen from gas, BP could reduce its GHG emissions by an additional 5-9 MtCO2e in FY30 and 59-93 MtCO2e in FY50.
Chart: Carbon intensities used in our GHG emissions forecasts for BP (CO2e/MJ)
Carbon intensity for renewable hydrogen, renewable traded power and renewables generation is assumed to be zero, although we note that some emissions may be generated from the production of renewable infrastructure (much like existing oil and gas assets). Other carbon intensities for oil products, gas products, bioenergy and power products (electricity generation excluding renewables) represent BP’s average marketed emissions intensities by fuel between FY19 and FY20. When compared to Shell, BP’s carbon intensities are broadly aligned except for bioenergy which is 27% lower at BP (BP 28.5g CO2e/MJ vs Shell BP 39g CO2e/MJ).
BP’s Aim 2 (scope 3 emissions upstream oil and gas production) includes 360.6MtCO2e as of FY19. This reflects the implied GHG emissions of BP’s own oil and gas production assuming it is combusted (category 11). This excludes any additional scope 3 categories.
Assuming scope 1 and 2 emissions remain constant, we estimate the difference in scope 3 intensity implied from its marketed energy products compared to combustion of oil and gas is around 11.2 CO2e/MJ and 9.9 CO2e/MJ respectively. By using this definition, BP has excluded ~60 MtCO2e of emissions from its target.
Table: BP carbon intensity for oil and gas (g CO2e/MJ)
| Carbon intensity from combustion | Implied Scope 3 Carbon intensity (Aim 3) | Difference | |
|---|---|---|---|
| Refined oil products | 70.9 | 82.1 | 11.2 |
| Gas products | 53.5 | 63.4 | 9.9 |
Source: Company data, United States Environmental Protection Agency, Global Climate Insights estimates
BP is a large business; in FY19 we estimate the energy from products it sells to be 30.6 EJ. We estimate the largest contributors to energy sold in FY19 were sale of third-party refined oil products (29%), sale of unrefined crude (20%) and sale of other traded products (likely gas, 17%), none of which are accounted for in BP’s pre-FY50 absolute emission targets.
By FY30, BP’s total energy sold is forecast to increase 4.4% on FY19 to 31.3 EJ. The following reflects the changes attributable to its net increase:
~12.2% increase attributable to:
‘Physically traded’ sales of energy products and unrefined crude oil, which make up a combined 59% of total energy in FY19, are assumed to be kept constant until FY30. This will keep the associated emissions from these products constant through to FY30, which is in line with BP’s guidance on marketed emissions. BP has not provided any guidance on the future growth of these products, making an accurate emissions forecast extremely difficult.
We see a risk that our assumption may understate the growth in BP’s future GHG emissions. For shareholders to assess emission reduction targets, growth aspirations across all oil and gas products need to be disclosed. In contrast to BP, the IEA NZS shows a 25% decline for oil consumption and 17% decline in gas consumption.[31]
Chart: BP annual energy sold by fuel type (EJ)
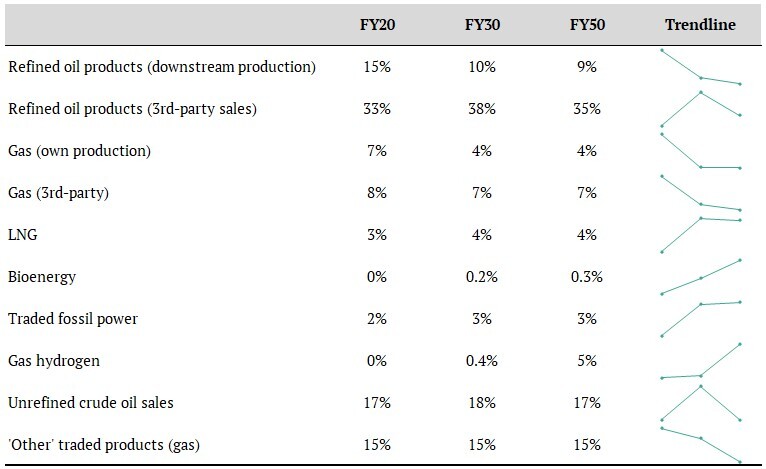
At FY30, our forecasts indicate that oil will continue to be the predominant driver of energy sold for BP, comprising 60% of energy (61% in FY20); this is followed by gas 32% (36% in FY20), traded power 6% and renewables 2%. In FY30 hydrogen and biofuels are not expected to be a material contribution, at <1% each.
At FY50 oil is expected to comprise 43% of energy sold, gas 25%, traded power 13%, renewables 9%, hydrogen 8% and biofuels ~1%. We expect BP’s mix of low-carbon fuels (bioenergy, renewable generation, hydrogen using renewables, renewable traded power) to account for 5% of BP’s total energy profile in FY30 and 25% in FY50.
Chart: BP sales of high carbon vs low carbon fuels (EJ, LHS) and (% low intensity products, RHS)
Table: BP’s percentage of annual energy sold by fuel type
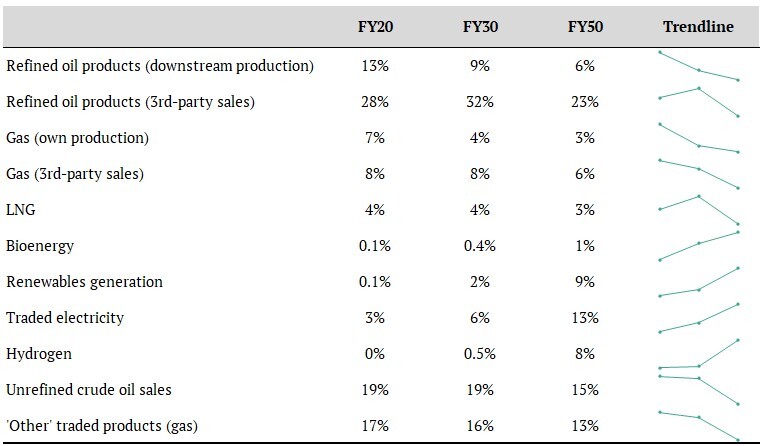
Source: Company data, Global Climate Insights estimates
Key assumptions
Total oil and gas: Oil and gas products that BP sells across its business account for ~97% of energy sold in FY20. Unlike Shell, BP does not disclose the proportion of total marketed energy sold by product and so it is difficult to know which oil and gas products are most significant. To estimate the energy for these products we have relied on two statements from BP (as below) and disclosures of sales by product from BP’s annual report.
Traded power composition (renewable vs fossil fuels): BP discloses the amount of power delivered to customers but does not provide a split of generation from renewables, nor any expectations around future generation split. We have taken our estimates from Shell’s Sky 1.5 scenario (40%/60% in FY30).
Hydrogen market size and split between feedstocks (renewables vs gas with CCUS): BP’s target to obtain 10% share of “core” hydrogen markets by FY30 has not been quantified. We have taken “core” to include Europe (location of planned hydrogen projects) and North America, which on BP’s data would account for around one-third of the total market by FY50.[32] We have used Shell’s estimate of the market size of hydrogen for consistency, which is considerably more optimistic than BP’s net zero scenario.
In our analysis we look at BP’s total GHG emissions in two ways:
As at FY20, GHG emissions from BP’s own downstream oil products and gas production accounted for 22% of its total GHG emissions, and third-party oil and gas around 76% (including unrefined crude) of total GHG emissions. By FY30 we expect its own oil and gas contribution to GHG emissions to decline to 14% of total GHG emissions, and third-party oil and gas to increase to 82% of total GHG emissions.
Chart: BP’s absolute GHG emissions of sold products by fuel (Mt CO2e, incl. decline from divestments)
In the table below we show our estimate of BP’s emissions of sold products by type. We find that despite oil and gas products contributing 98% to BP’s GHG emissions and 97% of all energy products sold in FY20, BP has set targets against just 17% of its emissions, leaving room for the remaining 81% of emissions to grow. This material exclusion allows increases in the unaccounted for emissions to negate any emission reduction it can achieve within its targets. This is before accounting for the emissions from divested assets that will continue to produce.
Table: BP’s sold products covered by absolute emissions targets (not reflective of actual reduction)
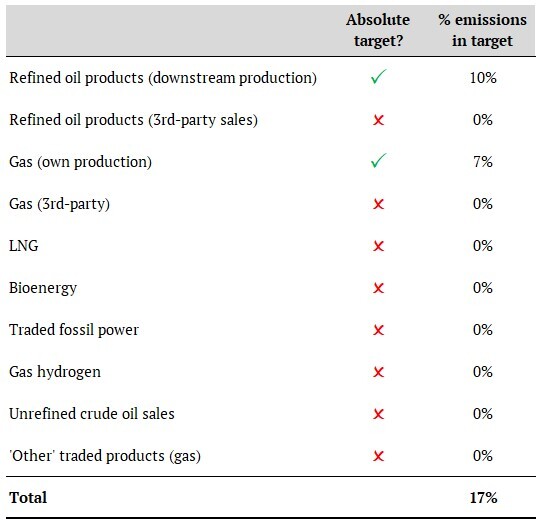
Source: Company data, Global Climate Insights estimates
Table: BP’s percentage of annual absolute emissions by fuel type (incl. decline from divestments)
Source: Company data, Global Climate Insights estimates
BP’s underlying production and portfolio ambitions will ultimately deliver no change in emissions from FY19 to FY30 (depending on BP’s actual sales of oil and gas, this could increase). Since BP notes that absolute emissions will continue to rise in the medium term, we estimate the lower bounds of BP’s emissions from sold products to be ~2,429 MtCO2e p.a. by FY30. When accounting for the annual emissions of divested assets, BP’s absolute emissions will rise a minimum of 6% to 2,582 MtCO2e p.a. between FY19-30. BP’s ambition to scale back upstream oil and gas production by 40% will result in an 8% decrease in emissions. However, this will be offset by at least a 11% increase in emissions from third-party hydrocarbons and divestments.
Chart: BP’s FY19 to FY30 absolute GHG emissions (Mt CO2e, includes emissions from divested assets)
BP’s carbon intensity is forecast to reduce 4% by FY30 to 76.4g CO2e/MJ (including divested emissions).
Chart: BP’s FY19 to FY30 carbon intensity (g CO2e/MJ, includes emissions from divested assets)
We forecast BP’s absolute emissions from sold products to fall to 1,794 Mt CO2e p.a. by FY50, a 26% reduction from the FY19 baseline. Emission reductions are heavily driven by scaling back oil and gas production and purchases, accounting for a combined reduction of 653 Mt CO2e by FY50.
When considering the impact of annual emissions from divested assets, BP’s total emissions will only decrease by 20% on FY19 to 1,947 Mt CO2e. It is important to note that BP has not provided guidance on their divestment strategy post-FY30; therefore all reductions in oil and gas are assumed to be via run-off.
Chart: BP’s FY30 to FY50 absolute GHG emissions (Mt CO2e, includes emissions from divested assets)
BP’s carbon intensity is forecast to reduce 19% by FY50 to 61.6g CO2e/MJ (including divested emissions).
Chart: BP’s FY30 to FY50 carbon intensity (g CO2e/MJ, includes emissions from divested assets)
A key question for investors is whether BP will be able to meet its own targets based on its current strategy. We forecast BP will achieve some FY25 targets, but there are no visible pathways to its targets from FY30 to FY50. BP’s absolute emissions reduction targets hinge on divestments of oil and gas assets; when accounting for the impact of divestments, BP will not achieve any of its emissions reduction targets.
BP’s Aim 1 is to achieve net-zero scope 1 and 2 absolute GHG emissions by FY50 or sooner. BP is targeting a reduction of 20% by FY25 and 50% by FY30. Its key levers include ‘portfolio changes’ via divestment of upstream oil and gas assets and efficiency improvements. BP’s scope 1 and 2 emissions account for ~2% of BP’s estimated total emissions. Based on BP’s aspirations we forecast it will achieve its FY25 target, but not its FY30 and FY50 targets. We forecast divestments will account for ~80% of its FY30 scope 1 and 2 emission reductions.
Chart: BP’s Aim 1 vs forecast (Mt CO2e)
Table: BP Aim 1: Reduction in absolute scope 1 and 2 emissions from operations
| FY19 | FY25F | FY30F | FY50F | |
|---|---|---|---|---|
| GHG emissions forecast (Mt CO2e) | 54.4 | 40.3 | 31.5 | 22.0 |
| Forecast change from FY19 (%) | - | -26% | -42% | -60% |
| Of which, divestments (%) | - | -16% | -33% | -33% |
| Aim 1 targeted reduction (%) | - | -20% | -50% | -100% |
| Aim 1 implied emissions (Mt CO2e) | - | 43.5 | 27.2 | 0 |
| BP targets achieved? | - | Yes | 8% gap | 40% gap |
Source: Company data, Global Climate Insights estimates
BP’s Aim 2 is to achieve net-zero scope 3 GHG emissions from its upstream oil and gas operations on an absolute basis by FY50 or sooner. This will include a 20% reduction in scope 3 emissions by FY25 and a 35%-40% reduction by FY30. Like Aim 1, the key lever for achieving this target will be divestment of upstream oil and gas assets. It is important to note that oil and gas from BP’s own upstream production accounts for ~20% of total oil and gas sold; therefore, ~80% of oil and gas output is excluded from Aim 2. BP’s scope 3 emissions from upstream oil and gas operations account for ~15% of total emissions excluding Rosneft.
As highlighted in Section 3.2.2, we have used EPA combustion factors to estimate scope 3 emissions. As illustrated in the chart below, BP will likely achieve its FY25 and FY30 targets, but will not achieve its FY50 target. Like Aim 1, divestments will account for almost 80% of reductions in scope 3 emissions by FY30, and BP will significantly fall short on all of its milestones when including the impacts of these emissions.
Chart: BP Aim 2 vs forecast (MtCO2e)
Table: BP Aim 2: Reduction in absolute scope 3 emissions from upstream production
| FY19 | FY25F | FY30F | FY50F | |
|---|---|---|---|---|
| GHG emissions forecast* (Mt CO2e) | 359.5 | 276.5 | 215.7 | 149.9 |
| Forecast change from FY19 (%) | - | -23% | -40% | -58% |
| Of which, divestments (%) | - | -15% | -32% | -32% |
| Aim 2 targeted reduction (%) | - | -20% | -35% to -40% | -100% |
| Aim 2 implied emissions (Mt CO2e) | - | 287.6 | 233.6 to 215.7 | 0 |
| BP targets achieved? | - | Yes | Yes | 42% gap |
Source: Company data, Global Climate Insights estimates, *Based on EPA emission factors of crude oil and natural gas
BP’s Aim 3 is to cut the carbon intensity of energy products sales (ex-crude oil) by 100% by FY50 or sooner. This will include a 5% reduction by FY25 and a 15%-20% reduction by FY30.
Following its 4Q21 results, BP expanded Aim 3’s scope to include ‘physically traded’ sales of energy products; while BP has not yet provided the carbon intensity for this it has indicated that ‘physically traded’ sales contribute ~1 Gt CO2e of emissions per year, taking the absolute emissions associated with energy product sales to ~2Gt. We estimate that BP will fall short on its carbon intensity targets. We expect BP will miss its FY25 target by 3%, FY30 target by 10-15% and FY50 target by 72%. While BP is decreasing its carbon intensity for energy product sales, absolute emissions are not forecast to decline and may even rise, depending on BP’s growth in ‘physically traded’ sales of oil and gas which make up ~50% of emissions.
Chart: BP Aim 3 vs forecast (gCO2e/MJ)
Table: BP Aim 3: Reduction in carbon intensity of energy products sales (ex. unrefined crude oil)
| FY19 | FY25F | FY30F | FY50F | |
|---|---|---|---|---|
| Intensity forecast (g CO2e/MJ) | 81.5 | 79.5 | 77.3 | 58.4 |
| Forecast change from FY19 (%) | - | -2% | -5% | -28% |
| Aim 3 targeted reduction (%) | - | -5% | -15% to -20% | -100% |
| Aim 3 implied intensity (g CO2e/MJ) | - | 77.4 | 69.3 to 65.2 | 0.0 |
| BP targets achieved? | - | 3% gap | 10-15% gap | 72% gap |
Source: Company data, Global Climate Insights estimates
No. Our assessments of whether corporate decarbonisation plans align with the Paris Agreement’s ambition to keep warming to 1.5°C are based on:
As we have detailed above, BP will not reduce absolute emissions between FY19 and FY30. In addition, the gap of its absolute emissions compared to the proportionate decrease illustrated by the IEA NZS is significant, at -36% (-42% including emissions from divested assets).
Chart: Absolute emissions reduction FY19 to FY30/FY50, forecast for BP (CO2e) vs Net Zero Scenario (NZS, CO2)
Absolute emissions from sold products for BP could greatly exceed that set out in the IEA NZS
By FY50, we forecast BP absolute emissions to decrease by 26% (20% including emissions from divested assets), compared to a 73% decline required in the NZS.
Although companies account for emissions on an annual basis and commonly use year on year change to measure progress, it is important to understand that greenhouse gas emissions remain in the atmosphere for centuries after they have been emitted.[33] The “stock” of emissions produced by a company, as well as ongoing annual emissions, are what’s driving human-induced climate change today.
The global remaining carbon budget to stay on course for a 1.5°C warming is around 620.4 Gt CO2e[34] between FY21 and FY50, with BP forecast to contribute 11.1%.
Chart: BP’s impact on remaining carbon budget FY21-50
Table: BP’s impact on remaining carbon budget FY21-50
| Global carbon budget | BP cumulative absolute emissions of sold products | BP cumulative emissions from divested assets | BP total cumulative underlying emissions | |
|---|---|---|---|---|
| FY21-50 cumulative emissions (Gt CO2e) | 620.4 | 65.0 | 3.9 | 68.9 |
| Percentage of remaining carbon budget (%) | - | 10.5% | 0.6% | 11.1% |
Source: Company data, Global Climate Insights estimates
| FY21 production | FY30 target | Pipeline | BP expected IRR |
|---|---|---|---|
| ~0.6 Mt used in operations[35] (from gas hydrogen without CCUS) | 10% share of ‘core markets’, est 1.2 Mt production | 0.3Mt | Double digit[36] |
Hydrogen is expected to be one of the key fuels for the energy transition; under the IEA NZS it is expected to account for 2.6% of energy consumption by 2030 (10 EJ) and ~11% of energy consumption by 2050 (37 EJ).[37] This does not include growth in the use of hydrogen for feedstock in industrial and chemical processes. Hydrogen is expected to account for 3% of fuel consumption in 2030, increasing to 19% by 2050, and 3% of electricity in 2030, declining to 2% by 2050.
Hydrogen can be made from a combination of feedstocks (fossil fuels, biomass, water or a mix) and energy sources (fossil fuels or renewables). Gas is the dominant source of feedstock for hydrogen production today, accounting for 76% of global hydrogen production and 6% of global gas demand.[38]
In total IEA NZS expects that in 2030, 212 Mt of hydrogen could be consumed across feedstocks, fuel and electricity generation, which will increase to 528 Mt by 2050.[39] In 2030 the major uses of hydrogen are expected to be feedstock for chemicals (26%), blending with gas grids (26%), electricity generation (13%) and transport (10%). By 2050, the use of hydrogen is expected to be largely for transport (38%), electricity (19%), chemicals (11%) and the gas grid (11%).
BP aims to reach a 10% share of ‘clean hydrogen’ in ‘core markets’ by FY30. Clean hydrogen refers to hydrogen produced via electrolysis and generated from renewable sources (green hydrogen) and hydrogen produced from natural gas with CCUS (blue hydrogen). We have assumed this to be around 3% of the total clean hydrogen market size in FY30 (using Shell’s hydrogen market estimates), reflecting BP’s focus on Europe and the United States (~1.2 Mt p.a. assuming ~10% of the ‘core markets’, equivalent to 12 Mt).
We estimate that BP currently has around 0.3 Mt p.a. of hydrogen in development for 2030, equally split between renewable and gas with CCUS (see section 7.0 appendix for project overview). Part of this development pipeline is likely to replace BP’s existing hydrogen production. The amount of hydrogen production BP has in development is materially less than what would be required to reach its aims.
BP has one gas hydrogen (with CCUS) project in development, H2Teeside (0.175 Mt p.a.)[40] and five renewable hydrogen projects (total 0.15 Mt p.a.). Its projects are mostly at the feasibility stage and none has reached FID.
Teesside is an industrial cluster that is being created in northeast England for emission-intensive industries. BP is partnering with CO2 emitting industrial customers (gas sourced hydrogen, fertilisers) within the cluster to help them store carbon. This project is known as “Net Zero Teesside” (NZT). BP operates two projects: the build of a gas-fired power station (“NZT Power”), for which BP will store carbon emitted, and H2Teesside, the gas-based hydrogen project. It is unclear why BP is building a new gas power station or building a power station at all. BP expects the two projects to capture 4Mt of CO2 (2Mt each); this is further discussed in the section on CCUS (see section 5.1).
As part of BP’s renewable pipeline, it has another project at Teesside, which is its Hygreen renewable hydrogen project (0.077 Mt by FY30). This is currently at the feasibility stage and is the largest renewable hydrogen project BP has announced.
BP is in its very early stages of hydrogen production and remains very far from its FY30 target. The renewable hydrogen projects it has in development appear promising, although they will largely be used to replace hydrogen from BP’s refineries, rather than creating a new product to transition their customers. The gas hydrogen project at Teesside is large (more than double the green hydrogen project), and BP has not provided details on the expected end-use.
BP plans to produce 1.5GW of hydrogen at Teesside, 30% of the UK’s 2030 5GW target[41]. It could be that the UK's focus on hydrogen for use in heating is driving BP’s investment in gas with CCUS hydrogen today. We question if the investment in gas hydrogen makes sense financially given decreasing costs for renewable hydrogen[42] and for the climate given gas-based hydrogen is highly energy (and carbon) intensive and only 60% of emissions can be readily captured and stored (assuming steam methane forming (SMR) for hydrogen production).[43] In addition, air source heat pumps are a more cost-effective way of heating the buildings sector.
Table: BP’s hydrogen position (see section 7.0 appendix for project overview)
| Target | 10% hydrogen share in ‘core markets’ by 2030[44] (1.2 Mt p.a. by 2030). We have assumed this to be around 3% of the total market size in 2030 (using Shell’s hydrogen market estimates), reflecting BP’s focus on Europe and the United States. |
|---|---|
| What does it plan to make? | Gas-based hydrogen production with CCUS Renewable hydrogen |
| Current production | None. Gas-based hydrogen production without CCUS: 0.6 Mt p.a. |
| How is BP tracking against its target? | BP has not made material progress in meeting its targets. All projects are pre-FID. |
| Contribution to energy sold (GCI forecast) | FY30 = ~144,000 TJ (1%) FY50 = ~2,500,000 TJ (14%) |
| Key projects or partners | Gas with CCUS Hydrogen (0.175Mt p.a.[45] planned development): H2Teesside (H2T). Part of Net Zero Teesside (see section 5.1: CCUS) Renewable hydrogen (0.15Mt p.a. planned development): Hygreen Teesside (FID 2023). H2-Fifty, partners: Nouryon, Port of Rotterdam Lingen, partners: Ørsted (FID 2022) Castellón, partners: Iberdrola, Enagas Geraldton, on hold[46] |
| Use of CCUS/ carbon offsets | Yes (H2Teesside, UK), estimated to be 2Mt CO2 p.a. |
| End use | BP does not provide details on end-customers. We believe some will be used to replace its current hydrogen used in refineries and some used in the UK’s gas networks for domestic heating. |
| Risks to decarbonisation | Hydrogen produced from gas with CCUS is highly emissions-intensive (~100 gCO2e/MJ[47]), and carbon capture can only readily reduce emissions by 60%. |
| Risks to strategy | Lack of clarity on the targeted size of the market, source of hydrogen production and end-use for hydrogen production. |
Source: Company data, Global Climate Insights estimates
| FY21 production | FY30 target | Pipeline | BP expected IRR |
|---|---|---|---|
| ~17 kb/d ethanol equivalent (kb/d), largely bp Bunge | 100 kb/d ethanol equivalent (kb/d) Includes a 20% share of SAF supply (40 kb/d), 10 kb/d biogas | Investing in 5 biodiesel/SAF projects, 3 bioplants, 2 refinery conversions. We estimate BP has production announced to meet ~65% of its target | >15%[48] |
As part of its decarbonisation strategy BP is focused on the growth of biofuels through its “Bioenergy” division. This includes both fuels (liquids) and gas produced from biomass. Products within the bioenergy division include production of ethanol for fuel blending, sustainable aviation fuels (SAF), biopower (electricity generated from the ethanol), biogas (for heating, cooking or electricity from biowaste), and refinery co-processing for the creation of chemicals and non-combusted oils. In our consideration of biofuels, we are excluding the combustion of plantation timber combined with CCUS (termed Bio-Energy with Carbon Capture and Storage, BECCS).
In 2020, 5.3% (18 EJ) of total fuel consumption came from what IEA terms “modern” biofuels (excludes firewood and charcoal for heating and cooking). In the IEA NZS the contribution of modern biofuels is expected to increase to 13.6% (40 EJ) by 2030 and 28.2% (49EJ) by 2050. Biofuels are expected to contribute 12% (12 EJ) to transport energy demand by FY30, up from 3% (3 EJ) in 2020. This is expected to stay consistent towards 2050 (13 EJ by 2050) as electrification deepens within the sector. Sustainable aviation fuel (SAF) supply is growing very rapidly towards 2030 in the IEA NZS, from close to 0 to 2% (2030) and almost 8% (2050) of the liquid biofuel supply.
BP wants to grow biofuels to 50 kb/d (2.9GL/y) in FY25 and over 100 kb/d (5.8GL/y) by FY30 (0.8% of global production[49]). BP’s current biofuel production is 17 kb/d (2021, 1.0GL/y, 0.6% of global production[50]). The only producing biofuel business that BP discloses production for is bp Bunge Bionenergia, a 50/50 joint venture with Bunge Bioenergia in Brazil that supplies ethanol for fuels and electricity generation from sugarcane agricultural waste. BP entered into this joint venture in 2019. bp Bunge Bioenergia has a 26kb/d capacity. Given the 17kb/d production in 2021, BP appears not to be using its current capacity. BP also mentions 5 kb/d production at refineries through co-processing.
BP has provided high level details on where its increase in biofuels may come from. It has indicated that bp Bunge Bioenergia will grow production to 40 kb/d[51] by 2030. It wants to triple biofuel production at existing refineries to 15kb/d by FY30.[52] BP has stated it will invest in five projects producing biodiesel and SAF, three bio-plants adjacent to existing refineries, and two refineries that will be converted to bio-refineries. BP also wants to grow biogas 20-fold to 10 kb/d by FY30 and attract additional offtake, as it believes biogas will grow faster than the 6% per year biofuels average to 2030.[53] It recently announced a partnership with Aria Energy (2021, now Archaea Energy), capturing gas from dairy farms for use in transportation (biogas) in the US (amount not quantified), and acquired a 29% stake in Gasrec, which supplies biogas to heavy goods vehicles in the UK. BP also aims for a 20% share of SAF supply by FY30.[54] Fulcrum Bionenergy, Neste and Nuseed will supply BP with SAF through offtake agreements, with BP distributing the SAF to market.[55],[56] Fulcrum has completed construction of its first Biorefinery in the US which converts Municipal Solid Waste (MSW) into synfuels which can be upgraded to SAF.[57] Given the existing supply capacity, we believe that the current SAF supply to BP is in the order of 1 kb/d.[58] BP also announced a partnership with Qantas to supply SAF from 2022 onwards, and is producing some undisclosed amounts of SAF itself at its refinery in Castellon, Spain.
The announced growth in liquid biofuel production (to ~40 kb/d by 2030), the announcements around biofuels from existing refineries (15 kb/d by 2030) and biogas (10 kb/d by 2030) only amount to around 65 kb/d of the 100 kb/d FY30 target. The 20% SAF target by 2030 (40 kb/d in the IEA NZS)[59] would fill the gap, but BP itself has indicated the amount is closer to 5 kb/d.[60]
BP specifies where growth in biofuels will occur, but it remains unclear how it will reach its 100 kb/d target in 2030. BP would reach 100 kb/d by 2030 if it grew its SAF supply to a 20% share of the IEA NZS for SAF demand (40kb/d), but we believe that growth is not in line with BP’s aims (~5 kb/d). BP would need to grow its current biofuels production more than 5-fold by FY30. Within liquid biofuels (ethanol) BP’s focus is growing production, but for biogas and SAF its focus is on distribution and marketing. There is concern around sustainable scalability of the ethanol production at bp Bunge Bioenergia. It is unclear if BP can scale using waste only or if it will lead to deforestation or the displacement of other agricultural crops.[61]
The conversion of existing refineries may be a good solution as conventional refining output will decrease towards FY30 (see hydrogen section 4.1), but more detail needs to be provided on the source of feedstock. The growth in biogas through methane capture from agriculture is a sensible development for the climate. BP does not mention any interest in sustainable biomass such as algae. Algae are a far more sustainable option but can have significant environmental impacts when improperly managed.[62]
The carbon emissions of biofuels and relative benefit compared to fossil fuels depends most on the type of biomass used (deforestation increases emissions and biomass must capture additional CO2 when there is a change in land use), the proximity of crops to facility (transport emissions) and the amount and type of energy used to process the biomass. Currently biofuels and SAF are still blended with fossil fuels, so the full potential emission reductions are not reached. BP divested some of its earlier assets[63] in biofuels (Vivergo and a demonstration plant making ethanol from wood waste), and it is unclear how much capability it has retained that would be useful in helping it achieve its FY30 targets.
Table: BP position on biofuels[64]
| Target | Biofuel production 50 kb/d (2025), >100 kb/d (2030) |
|---|---|
| What does it plan to make or provide? | Produce: Bioethanol for fuel use and power production (from sugarcane waste) Distribute: Biogas (third-party, from waste) Sustainable Aviation Fuel (third-party) |
| Current production | Biofuels: 17 kb/d^65 |
| Key projects or partners | bp Bunge Bioenergia (Brazil): ethanol for fuels (capacity: 26 kb/y, 40 kb/y by 2030) and electricity from agricultural waste Archaea Energy (US): gas from agricultural sources (undisclosed amount) Fulcrum BioEnergy: 3.3 kb/d SAF supply to BP (after 2022)[65] Neste: SAF supply to BP (undisclosed supply amount)[66] Nuseed: Carinata oil supply to BP for SAF and other biofuel production (undisclosed supply amount)[67] Qantas: SAF supply and strategic partnership (0.17 kb/d in 2022 to 0.52 kb/d in 2024)[68] |
| CCUS/carbon offsets | Not mentioned |
| End-use | Fuels: road transport, shipping and aviation Electricity: BP mentions the use but it is not contemplated in the IEA NZS outside of combustion of plantation timber combined with CCUS (BECCS) |
| Risks to decarbonisation | Land and fertiliser use is a crucial contributor to emissions and could negate any emissions savings that the biomass could otherwise provide. |
| Risks to strategy | BP does not quantify how it will meet its targets, and how significant the contribution will be from current projects in its pipeline. No capital investment requirements have been identified for biofuels. |
Source: Company data, Global Climate Insights estimates
| FY21 production | FY30 target | Pipeline | BP expected IRR |
|---|---|---|---|
| 2.5GW under construction and 1.9GW operational[69] | 50 GW | 23.1GW (solar 19.4 GW and offshore wind 3.7 GW) as of FY21 | > 8-10% levered[70] |
Installed solar and wind capacity was almost 1,500 GW globally in 2020, supplying 9% of total generation, and in the IEA NZS is projected to grow to 8,000 GW by 2030 supplying 40% of total electricity generation.[71]
In FY21 BP had installed renewable capacity of 1.9GW, up 27% from 1.5GW in FY20. BP does not disclose how this is split by solar and wind, nor does it disclose energy generation. In FY21 BP had 4.4 GW of projects in development (ie. have reached FID), an increase from 3.3 GW in FY20. The majority of its projects appear to come from Lightsource bp, of which BP owns a 50% stake. BP’s pipeline of renewable generation as at FY21 was 23.1 GW, more than doubling from FY20; 9GW of the increase was through the US$220m acquisition of solar developments from 7X Energy and ~3.2GW through greenfield projects. Split by type, solar accounts for 19.4GW (84%) of the pipeline and offshore wind 3.7 GW (16%).
The key offshore wind projects are BP’s joint ventures with Equinor and EnBW; these are some of the largest offshore wind projects globally. In FY21, BP spent US$1.56bn on its low carbon energy business, which includes over US$1bn towards its offshore wind projects (including licence costs).[72]
Table: BP overview of key solar and wind projects
| Solar | Wind | Total | |
|---|---|---|---|
| BP generation target | Not disclosed | Not disclosed | FY25: 20 GW FY30: 50 GW |
| Project pipeline FY21 | 19.4 GW 9 GW acquired solar developments from 7X Energy (2021) | 3.7GW (BP share, offshore wind only) 50/50 BP and Equinor: Beacon Wind, US 2 GW Empire Wind, US 2.4 GW EnBW and BP (% not disclosed): Morgan and Mona, Round 4, Wales 3 GW Morven, E1 Lease, Scotland 2.9 GW | FY21: 23.1 GW |
| Key projects developed (reached FID as at FY21) | Lightsource bp ~1.5GW: Wellington, Australia 0.6 GW Elm branch, US 0.3 GW Masdar Baku, Azerbaijan 0.29 GW Operational projects disclosed: Vendimia, Spain (Lightsource bp), 0.25 GW | No additional FID projects disclosed, additional ~1GW implied Operational Onshore Wind: Fowler Ridge, UK (Dominion and bp,50/50), 0.3 GW | FY21: 4.4 GW (BP share) 2.5 GW under construction and 1.9GW operational |
Source: Company data, Global Climate Insights estimates
BP has made significant advancements towards its renewable energy generation targets, with 4.4 GW of installed capacity and an additional 23 GW in its pipeline. This total of 27.4 GW exceeds BP’s 20 GW target for FY25 and is over 50% of its FY30 target. We estimate BP’s FY30 target is some 30% smaller than Shell’s FY30 target[73].
In comparison to solar, where Lightsource bp operates the assets, BP does not operate its offshore wind assets; instead, it appears to bring expertise in financing and site assessments. For offshore wind projects, it utilises its in-house supply chain management and site assessment capabilities from its offshore oil and gas production operations, which BP states are a competitive advantage. BP estimates that 60 to 70% of the supply chain overlaps between offshore wind and offshore oil and gas.[74] BP has made investments in renewable energy since the late 1990s but pulled out in 2005, arguing the market was not ready. Today, global electrification is an absolute must for decarbonisation. Lightsource bp is one of the largest solar developers in the world and is well-positioned to grow its solar development pipeline.
The wind project pipeline is expanding rapidly with BP successful at acquiring licences. However, BP shows it also aims to grow through solar assets acquisition. This grows market share but does not accelerate renewable energy generation in itself.
To assess the effectiveness of its strategy, BP needs to provide more transparency on the contribution of each technology to its operations and the earnings attributable.
Table: Renewable Energy (Wind, Solar) overview and assessment
| Target | 20 GW (FY25), 50 GW (FY30) |
|---|---|
| What does it plan to make? | BP has not defined any specific targets for wind or solar. BP’s solar pipeline is through Lightsource bp. In offshore wind, BP is building generation through partnerships where it is not the operator. |
| Current energy sold | 1.9 GW (FY21) |
| Energy forecasts | 20 GW (FY30) 50 GW (FY50) |
| End-use | Electricity generation |
| Risks to strategy | There is a clear established need for renewable generation for energy transition and BP appears to have found a clearer role in development of renewable projects, leaning on Lighstource bp expertise for renewables and its offshore project expertise for wind. As with all large scale projects, execution risk and delivering appropriate returns in the face of increasing input costs and licences will remain something BP will need to manage. Hurdles rate targets of 8-10% should reduce the risk of pursuing lower return projects. |
Source: Company data, Global Climate Insights estimates, *gross nameplate generation, does not account for capacity factors and is the sum of developed renewables to the final investment decision. Assumes FID target is fully operational, however large projects have a several years lead time between FID and start up.
| FY20 production | FY30 target | Pipeline |
|---|---|---|
| 214TWh, FY21 not disclosed | 500TWh | Expected to be a mix of electricity delivered through the grid including EV charge points and potentially retail customers. May include BP’s own generation. |
According to the IEA NZS global electricity demand is projected to increase by 43% between 2020 and 2030. Traded electricity is disclosed under BP’s Gas and Low Carbon segment, and refers to electricity sold by BP, which we assume to include contracted sales to end customers and supply of electricity through electric vehicle charging points. Like Shell, this represents BP’s move further downstream into the distribution of energy products.
BP aims to increase its traded electricity from 214TWh in FY20 (0.9% of global demand) to 500TWh in FY30 (1.5% of global demand).[75] BP has signed deals to supply electricity with customers such as Amazon (supplying 574MW through several renewable power agreements).[76] Media have suggested that BP has applied for a licence to supply US residential customers with electricity under its brand BP Energy Retail.[77] This follows BP’s withdrawal of support in 2021 for UK renewable energy and gas supplier Pure Planet, in which it owned a minority stake and which went into administration following rising wholesale gas prices.[78]
As part of its strategy to increase electricity sales, BP will also increase electric vehicle charging points over 7-fold from 2021 to 2030 (from 13,100 to >100,000). In FY21, BP increased its EV charging footprint by 30% to 13,100.
As of FY20, 80% of BP’s electric vehicle charging points were located in the UK (bp pulse) and 20% in Germany. BP has joint ventures to provide EV charging solutions in India, through “Jio-bp”, as part of a broader partnership with Reliance Industries Ltd, which also includes expansion of petrol stations and associated retail offerings. In 2021 BP ventures invested US$13m in Blu-Smart, an EV ride-hailing and charging company in India, and an undisclosed amount in European company Digital Charging Solutions, which provides charging solutions for auto manufacturers. In China, BP has a joint venture “bp-xiaoju” with Xiaoju Energy, part of ride-sharing company Didi.[79] In addition, BP is working on a pilot with Uber in London and Texas. A separate focus area is EV fleets, where BP aims to provide EV hardware and fleet charging software services.
For the purpose of our analysis, we do not link BP electricity generation to electricity traded, as we expect it to be a mix of own generation and electricity from the grid. BP does not provide any details on how much of its own generation is included in traded electricity.
We don’t yet have a clear picture of how BP plans to participate in the sale of electricity, across wholesale, retail and EV charging. To date, the focus has been on entering agreements with large buyers (e.g. Amazon) for its renewable electricity generation and expanding its EV charging network. A question remains on how it will participate in the supply of retail energy globally and how this will impact BP’s business model.
BP appears to be making good initial progress on its EV charging footprint and has made a number of investments to support its goal. BP appears particularly focused on becoming a leader in Ultra Fast EV charging. We are supportive of BP’s focus on the accelerated build-out of EV infrastructure as it will assist in the adoption of EVs. For BP’s traded electricity target, it will be difficult to quantify the benefit to emissions from the electricity BP sells from the grid. We will be reliant on BP’s measurement of the carbon intensity of its electricity delivered to accurately assess the emissions. If BP’s traded electricity target includes its own generation, as well as selling of electricity in the grid, it appears to be relatively conservative. Assuming BP meets its renewable generation target in FY30, this would already account for ~36% of its traded electricity target (using BP efficiency factor).
Table: Traded electricity and EV charge points
| Target | Traded electricity: 350TWh (2025), 500 TWh (2030) Electric vehicle charging points: >40,000 (2025), >100,000 (2030) |
|---|---|
| What does it plan to sell? | Electricity |
| Current production | Traded electricity: 214TWh (FY20, not disclosed FY21) Electric vehicle charging points: 13,100 (FY21) |
| Key projects or partners | EV charging network and investments: bp pulse - UK bp-xiaoju (joint venture with Didi) - China Jio-bp (part of broader joint venture with Reliance) - India 33.3% stake in Digital Charging Solutions - Europe US$13 million investment in BlueSmart - India Acquisition of Amply Power (EV fleet charging services) - US Traded electricity: Offtake agreement for renewable energy with Amazon |
| Risks to decarbonisation | Expansion of EV charging points in India and China is a key driver of BP’s strategy. Unless BP provides renewable electricity generation in these markets, it will be reliant on the grid for decarbonisation. |
| Risks to strategy | More information is needed to understand BP’s approach to electricity sales across wholesale, retail and EV charging. This will impact its capital requirements and the businesses risk and return. |
Source: Company data, Global Climate Insights estimates
Carbon capture and offsets are considered post-emissions compensation technologies. Both have limitations in their ability to ‘neutralise’ greenhouse gases that have already been generated and are commonly considered tools of last resort for hard-to-abate sectors. Capital expenditure in carbon compensation technologies should be scrutinised in the context of proven emissions reduction options available today.
BP defines Carbon Capture Utilisation and Storage (CCUS) to include both enhanced oil and gas recovery (where CO2 is used to increase oil and gas production) and permanent carbon sequestration.
BP seeks ‘early positions’ in CCUS as a part of its target setting, without quantitative measures of success. It has announced two projects that together aim to store 4Mt CO2 p.a. permanently. The H2Teesside blue hydrogen project discussed in the hydrogen section 4.1 above will store 2Mt CO2 p.a. and its Net Zero Teesside (NZT) Power gas-fired power station, also in the Teesside region, will store up to 2Mt CO2 p.a. The two projects form part of the NZT consortium that aims to decarbonise an industrial cluster in the Teesside region, with the aim to sequester a total of 10Mt CO2 p.a., of which 6Mt CO2 p.a. would come from other customers. It is expected that the carbon will be stored offshore. This site will also be used to capture carbon from another industrial cluster in the UK called the Humber, in which Equinor is involved. It is unclear how much investment NZT has seen so far and how much is required, but it has secured £76m of public funding and £153m of private funding in 2021.[80]
BP has completed a feasibility study to develop CCUS for Tangguh LNG, Indonesia which would sequester 25 Mt (in total) of CO2 from the gas stream (~15% CO2).[81] This CO2, however, is used to recover more gas out of the mature parts of the reservoir.[82] In 2020 BP announced it had entered an MOU with Santos for the Moomba CCUS project, investing $20 million in the project.[83]
CCUS is not a core part of BP’s business, evidenced by its two CCUS projects. The projects in the UK seem to be linked to UK government decarbonisation targets. The other CO2 capture project intends to use CO2 for enhanced gas recovery (EGS). It has been shown that only a portion of the CO2 injected for enhanced recovery is permanently stored.[84] Moreover, the additional gas will lead to increased scope 3 emissions.
Greater use of CCUS is associated with greater emissions overshoot, according to the IPCC Special Report on 1.5°C. We find capturing carbon for enhanced oil or gas recovery particularly problematic as it emits more CO2 than it stores, through the production of additional fuels. CCUS projects also have a poor track record of delivering economically feasible emissions reduction. Today there are 6 projects in operation globally with dedicated CO2 storage, storing less than 9 Mt CO2 p.a.[85]
Table: CCUS overview and assessment
| Target | No target, only “seeking early positions” | ||
|---|---|---|---|
| Where will it be used? | Teesside (UK): Capturing 10Mt of CO2 from a combination of industry (including BP’s new gas power plant) and CO2 from BP’s new hydrogen plant (H2Teesside), sequestering the CO2 in an empty offshore oil or gas field or aquifer Tangguh (Indonesia): Using CO2 to enhance gas production, ~25Mt | ||
| Current utilisation and storage production | BP does not have any dedicated CCUS projects in operation. | ||
| Key projects or partners | Pre-FID projects: Carbon capture and permanent storage: | ||
| Teesside (start up: 2026) and Humber (1st phase start up 2026), UK | |||
| --- | --- | --- | --- |
| Consortium | What does it do | Operator | Partners |
| Northern Endurance Partnership/ Net Zero North Sea storage | Build CO2 transport and storage infrastructure (10 Mt p.a. CO2 from NZT) | BP | National Grid, Equinor, Shell, Total and ENI |
| NZT (Net Zero Teesside) | Collection of industrial businesses at Teesside, UK (including BP’s new hydrogen plant using gas and CCUS, capturing 2 Mt CO2 p.a.) | N/A | bp (H2T), BOC, Kellas, CT Fertilisers, NZT Power, Suez, TV Erfv, 8Rivers |
| NZT Power | BP’s new gas fired power station aiming to capture 2Mt CO2 p.a. | BP | Equinor |
| Moomba, South Australia (start up 2024) - Non binding MOU Only | |||
|---|---|---|---|
| Project | What does it do | Operator | Partners |
| Moomba CCUS | CO2 storage, potentially EOR[86] | Santos (66.7%) | Beach Energy (33.3%), BP (financing only) |
Carbon Capture and Use:
| Tangguh LNG, Indonesia (start up 2026) | |||
|---|---|---|---|
| Project | What does it do | Operator | Partners |
| Vorwata CCUS | Capture and injection of 25Mt CO2 from reservoir gas for enhanced gas recovery | BP (40.22%) | MI Berau B.V. (16.30%), CNOOC Muturi Ltd. (13.90%), Nippon Oil Exploration (Berau) Ltd. (12.23%) and others |
| Risks to decarbonisation | High uncertainty of achieving intended outcome. Targets hinge on unproven advances in CCUS technology. This includes achieving a carbon capture efficiency of up to 95%. Impairment risk. Uncertainty in technologies creates risk of write-downs. Cost. There are associated capital expenditures and operating costs per tonne of CO2 captured. Capture rate. Not all CO2 can be captured, with peak capture rates estimated to reach 85-95%.[87] The higher the capture rate, the more expensive the CCUS technology. In CCUS used for Enhanced Oil or Gas Recovery (EOR/EGR), the storage rate tends to be lower than for dedicated storage projects, in particular in sandstone reservoirs.[88] Permanence of stored CO2. Storage sites will need to be monitored for leaks. The amount of CO2 stored may be significantly less if leaks are not accurately detected or addressed in a timely manner. In CCUS for enhanced oil recovery, it will likely lead to more lifetime emissions, rather than emissions reduction. Ongoing monitoring and liabilities. Companies will need to monitor and maintain sites over long durations of 100+ years. Additionally, companies will need provisions for costs to maintain sites, and account for the reversal of CCUS benefits that do not eventuate. Misalignment of incentives and timeframe. CO2 must be stored forever. In contrast, the entities responsible for meeting this obligation may last 50-100 years, and executive tenures of 3-10 years. There is a mismatch between the short-term incentive to produce and use CCUS vs the long-term environmental imperative to manage the CO2. Consequently, the cost is likely to be borne by future generations and governments. Energy intensity. CCUS requires a significant amount of energy, ranging from 0.25-0.3 MWh/tonne of CO2 captured.[89] Energy is often provided by fossil fuels, likely increasing Scope 1 and 2 emissions.[90] CCUS use in sectors with available low-carbon alternatives. BP’s investments should be positioned towards sectors that have no readily available renewable alternatives. | ||
| Risks to strategy | Our view is that CO2 used for enhanced gas recovery is not permanent storage of CO2 and should not be considered credible post-emissions compensation. |
Source: Company data, Global Climate Insights estimates
A carbon offset is “a way for a company or person to reduce the level of carbon dioxide for which they are responsible.”[91] A carbon credit represents the avoidance or removal of one tonne of CO2 in compensation for the emissions generated. Carbon offsets are sold in both compliance (cap and trade regulatory schemes) and voluntary markets. In both markets, the ability of underlying projects to demonstrate real and permanent emissions reduction differ widely. Importantly, at a climate response level, one carbon offset does not neutralise one carbon emitted.[92]
Does the world need carbon offsets? To help the world compensate for GHG emissions already released into the atmosphere, within the constraints of a carbon budget for limiting warming to 1.5°C, negative emissions will be required. Investments in proven and effective technologies that compensate for historical cumulative emissions are necessary and urgent. However, despite the recent focus on Net Zero corporate plans, negative emissions are not a corporate tool for balancing ongoing emissions; any use of carbon offsets to justify continued release of GHG emissions over reduction of those emissions will likely lead to delayed emissions reduction and an overshoot of the 1.5°C temperature target.
What role could BP have in the carbon offset market? The key participants in the carbon offset market include project developers, brokers/traders, intermediaries (buying for customers), and end-buyers (company/individual). We expect BP has aspirations to participate across the value chain, creating offset projects, selling offsets to other companies (including financial trading), selling offsets to individuals and using offsets for its own requirements.
What role in carbon offsets does BP have today? BP does not disclose its carbon offset use and has stated that it does not intend to use carbon offsets to meet its emission reduction targets before 2030,[93] but will disclose this year its use of offsets post-2030.[94] This is in contrast to Shell which is looking to use ~120Mt of carbon offsets to meet emission reduction targets by 2030. It is likely that some carbon offsets have been purchased to meet compliance requirements: reportedly, BP purchased 40 million credits between 2016 and 2020.[95]
In regards to BP’s role as a project developer, in 2020, it acquired a controlling interest in Finite Carbon, a carbon offset provider in the US with a portfolio of more than 50 projects, which states it has registered 90 Mt CO2 in offsets[96] through forest preservation. Finite Carbon is active in the US, Canada and Belize. BP also has a Low Carbon Trading team that procures carbon offsets for its customers and uses them through its Target Neutral initiative (to help customers reduce the scope 3 emissions from products BP sells)[97]. Some projects it has mentioned on its website include carbon offset projects in Mexico, India and China. In China, this includes a project generating carbon offsets from renewable energy projects that have replaced energy produced from fossil fuels, and another project installing more efficient wood cooking stoves. We see big issues regarding the reliable quantification of additional GHG emission reductions from projects like these. For the projects in Mexico, India and China, BP stated it has mitigated just over 0.5 Mt CO2 p.a.[98]
As part of its strategic partnership with Rosneft, BP was to assess opportunities around natural forest sinks and carbon offset credits in Russia.[99] The write-off of the Rosneft share implies this opportunity will not materialise.
To align with a 1.5°C scenario with no overshoot, we need to maximise investment in projects that can credibly provide additional removal of carbon and reduce and ultimately displace our reliance on processes that produce GHG emissions. Carbon offsets cannot be used to “green” carbon-intensive products with readily available zero-carbon alternatives. We believe BP has taken the right approach to not rely on carbon offsets for its emission reduction targets before FY30.
Our key concern for BP would be its use of carbon offsets in selling to customers including marketing “carbon neutral” products (such as Target Neutral). Separate targets for investments in socially beneficial projects should be created to recognise the positive impacts, without attributing it to ‘net off’ of emissions-intensive products. Most importantly, it should be a red flag to investors if a company is using carbon offsets (for customers or for its own strategy) without a reduction in absolute GHG emissions that aligns with a 1.5°C trajectory.
Table: Offsets overview and assessment
| Target | None. It will not use offsets prior to FY30; it may use them towards net-zero ambition in FY50. We therefore have not included offsets in our BP emissions forecasts. |
|---|---|
| BP’s role | We expect BP to participate across the carbon offset value chain: creating offset projects, selling offsets to other companies (including financial trading), selling offsets to individuals and using offsets for their own requirements. |
| Current production | Purchased at least 40 million credits (40Mt CO2) from Finite Carbon since 2016[100], possibly for offsetting scope 3 emissions of sold products. |
| Key projects or partners | Finite Carbon (80.5% stake) |
| Risks to decarbonisation | Volume required. There is a finite amount of nature-based projects that can be created for use as carbon offsets. It will be necessary to prioritise the use of offsets to sectors that have few alternatives to reduce emissions. Additionality of carbon offsets is difficult to quantify. Offsets are accounted for when commissioned while the physical carbon uptake occurs several decades later. Carbon offsets are always temporary, while fossil fuel emissions reside in the atmosphere for centuries. Double counting. Offset programs need to show that they result in additional emissions reduction, that emissions will be permanently stored, and avoid any double counting. In considering which carbon offsets are more likely to drive a reduction in CO2, we have a clear preference for creating new projects to store carbon over avoided emissions, given how difficult the benefits are to measure and verify. Overestimation risk. A 2016 study on the effectiveness of the EU Emissions Trading Scheme found 73% of potential certificates issued were likely to have overestimated emission reduction.[101] Lead time. Newly planted saplings take decades to mature.[102] The additional uptake of carbon declines over time and ceases to exist when the ecosystem matures.[103] Permanence. For nature-based carbon offsets, threats of wildfires, drought, and disease create a risk to permanence. Ensuring CO2 stored is reflective of the offset value will require a costly, complex, long-term monitoring program. Risk to biodiversity. Nature-based projects involving afforestation must be carefully managed to prevent overplanting of monoculture species for their absorption or fast growth over consideration of how it impacts local biodiversity.[104] |
| Risks to strategy | High. The value of carbon offset projects as a tradable credit to negate future emissions is highly speculative and creates a risk to achieving real emissions reduction. |
Source: Company data, Global Climate Insights estimates
The key terms we use in this report are listed in the table below.
| Term | Meaning |
|---|---|
| Abbreviated definitions of BP terminology | |
| Physically traded energy | Physically settled derivative sales. Primarily sales to large unbranded resellers and other oil companies. |
| Marketed energy | The scope of marketing emissions relates to total sales of energy products to an end-user (customer or business). Marketing sales of refined products includes branded and unbranded sales of refined fuel products to business-to-business and business-to-consumer customers, including service station dealers, jobbers, airlines, small and large resellers such as hypermarkets, and the military. |
| Liquids | Liquids for oil production and operations, gas and low carbon energy and Rosneft comprises crude oil, condensate and natural gas liquids. For oil production and operations and gas and low carbon energy, liquids also include bitumen. |
| Third-party sales | Energy products purchased from external producers and subsequently sold by BP. |
| Replacement cost profit | Replacement cost profit before interest and tax (excludes inventory holding gains and losses from profit or loss). |
| Underlying replacement cost profit | Underlying replacement cost profit before interest and tax (Replacement cost profit as above but also excludes “adjusting items” considered one-off or not reflective of underlying business performance). |
| Adjusted EBITDA | Adjusted EBITDA is defined as BP’s replacement cost (RC) profit before interest and tax, excluding net adjusting items, adding back depreciation, depletion and amortisation and exploration write-offs (net of adjusting items). |
| Cash Capital expenditure | As stated in BP’s cash flow statement. Includes organic capital expenditure (investments in building and maintaining assets) and inorganic capital expenditure (external business transactions and acquisition of shares). |
| Average Capital Employed | Average of beginning and end balance of total equity plus finance debt, excluding cash and cash equivalents and goodwill. |
Climate | |
| Total GHG emissions | In our analysis we use this term to refer to the total GHG emissions from products a company sells. We believe this provides a more holistic picture of the GHG emissions of a business, and is the best way for investors to understand how a company is tracking in its transition away from hydrocarbons. |
| Absolute GHG emissions | Absolute GHG emissions are the total amount of emissions being released into the atmosphere through a company’s value chain. For climate change to slow down, an absolute emissions reduction target is needed. It is also the more effective measure of the climate impact of emissions reduction, in comparison to an intensity reduction. |
| Carbon budget Historial carbon budget (CO2e) Remaining carbon budget (CO2e) | There are several types of carbon budgets. In this report, the term refers to the total net amount of emissions that can still be emitted by human activities while limiting global warming to 1.5°C above pre-industrial levels. Net zero emissions describe a situation in which all the anthropogenic emissions are counterbalanced by deliberate removal so that on average, no emission is added or removed from the atmosphere by human activities. The historial carbon budget is based on the historical annual mean greenhouse gas emissions from 1750 to 2019, accessed from https://rcmip-protocols-au.s3-ap-southeast-2.amazonaws.com/v5.1.0/rcmip-emissions-annual-means-v5-1-0.csv (see further details on rcmip.org) and 100-year Global Warming Warming (GWP) potentials for greenhouse gases listed in Table 7.SM.7 of the Ch. 7 Supplementary Material (https://www.ipcc.ch/report/ar6/wg1/downloads/report/IPCC_AR6_WGI_Chapter_07_Supplementary_Material.pdf). The Remaining CO2e carbon budget is calculated using the method outlined here (https://www.climatechange.vic.gov.au/__data/assets/pdf_file/0018/421704/Deriving-a-1.5C-emissions-budget-for-Victoria.pdf) in order to calculate a remaining CO2e budget to 2050. It is based on the remaining CO2 budget of 300Gt CO2 for a likelihood of 83% to stay below 1.5°C global warming relative to 1850-1900 (IPCC (2021) Summary for Policymakers in Climate Change 2021: The Physical Science Basis, Table SPM.2). To be able to use 2020 as a starting year a new intercept is calculated and the linear relationship becomes 1.235x + 249.2. This method accounts for the future earth system feedback and assumes no net negative emissions after 2050. It does not account for the additional warming that occurred prior to 1850-1900. While the term pre-industrial is defined by the starting year 1750, all IPCC modelling starts at 1850. There is however data and research that shows there has been anthropogenic warming prior to 1850-1900 (IPCC (2021) Summary for Policymakers in Climate Change 2021: The Physical Science Basis, Chapter 5, section 5.5). This would reduce the remaining carbon budget even further. |
| Carbon neutral | Carbon neutral means any CO2 released into the atmosphere from a company’s activities is balanced by the equivalent amount being removed through post-emissions compensation. It does not account for other greenhouse gases such as methane which can still contribute to increasing levels of global emissions. |
| Climate Action 100+ Net Zero Company Benchmark | Climate Action (CA) 100+ is an investor-led initiative engaging companies on improving climate change governance, cutting emissions and strengthening climate-related financial disclosures. In 2021 CA100+ launched a framework for assessing company performance on climate transition for high-GHG emitting stocks. The framework includes key indicators covering targets, strategy and governance. |
| IEA Net Zero Emissions Scenario (NZE), IEA NZS | A scenario produced by the IEA (2021) as part of its report Net zero by 2050: A roadmap for the global energy sector. It is one scenario that illustrates how energy demand and the energy mix will need to evolve if the world is to achieve net zero emissions by 2050. |
| Net GHG emissions | Net emissions, typically associated with ‘net zero’, are a company’s emissions footprint after accounting for post-emissions compensation. These are not necessarily ‘negative emissions’, as envisaged by the IPCC illustrative mitigation scenarios. Corporations should aim to thrive in a zero emissions economy, rather than ‘net zero’ in any particular year. |
| Post-emission compensation technology | Carbon offsets and carbon capture are both post-emission compensation measures. We consider both in our assessment of company targets but separately from the measures that reduce emissions from being released in the first instance. |
| Task Force on Climate-Related Financial Disclosures (TCFD) | The TCFD was created in 2015 by the Financial Stability Board (FSB) to develop consistent climate-related financial risk disclosures for use by companies, banks, and investors in providing information to stakeholders to support informed capital allocation. |
| Science Based Target initiative (SBTi) | The SBTi is a partnership between CDP, the United Nations Global Compact, World Resources Institute (WRI) and the World Wide Fund for Nature (WWF). It aims to define and promote best practice in emissions reductions and net-zero targets in line with climate science. It independently assesses and approves company targets in line with strict criteria. |
Source: Company data, Global Climate Insights
Table: Current renewable and gas-CCUS hydrogen projects in development
| Name | Location | End-use | Total planned H2 production | FID | Commissioning |
|---|---|---|---|---|---|
| Hydrogen from gas with CCUS | |||||
| H2Teesside (H2T) | Teesside, UK | Possible merchant, UK gas grid. Part of NZT (see CCUS) | 1GW, 0.175 Mt p.a. (GCI est.)[105] | 2024 (0.5GW) | 0.5GW (2027), 0.5GW (2030) |
| Renewable | |||||
| Hygreen Teesside | Teesside, UK | Merchant, likely UK gas grid | 0.5GW, 0.077 Mt p.a. (GCI est.) | 2023 | 0.060 GW (2025), 0.44GW (2030) |
| H2-Fifty | Rotterdam, Netherlands | Replacing existing gas hydrogen for refining | 0.25GW, 0.04 Mt p.a. | Not disclosed | 0.25GW (2023) |
| Lingen | Germany | Replacing existing gas hydrogen for refining | 0.05GW, 0.009 Mt p.a. | 2022 | 0.05GW (2024), >0.5GW (2027) |
| Castellón, Spain | Spain | Replacing existing gas hydrogen for refining | 0.115GW, 0.018 Mt p.a. (GCI est.) | Not disclosed | 0.02GW (2023) 0.095GW (FID not disclosed) |
| Geraldton | Geraldton, West Australia | Ammonia could be used for fuels in the future. | 0.0345MW, 0.02Mt p.a. | Not disclosed | On hold[106] |
| 0.32 Mt p.a. |
Source: Company data, Global Climate Insights estimates
Please read the terms and conditions attached to the use of this site.
BP Company initiation report, Part 1 | 28/03/22
BP (2022) BP Group results 4th quarter and full year 2021 ↩︎
FY21 capex excludes the Business and Corporate division. ↩︎
FY21 capex includes mobility, which is not separately disclosed. ↩︎
FY21 capex includes capex for biofuels which is not separately disclosed. ↩︎
Excludes GHG emissions associated with divestments. ↩︎
Shell FY21 Adjusted earnings ↩︎
Including BP share of Rosneft. ↩︎
BP defines marketed energy as CO2 emissions associated with the total sales of energy products to an end-user (customer or business). ↩︎
BP (2021) 4Q21 Earnings call ↩︎
Time (2021) BP's CEO Is Trying to Convince the World He's Serious About Going Green ↩︎
BP 2020 Resilient Hydrocarbons ↩︎
BP (2022) BP Group results 4th quarter and full year 2021 ↩︎
BP share of production of listed divested assets in 2020-21 compared to BP own production in FY21 (excluding Rosneft) and using BP carbon intensity factors ↩︎
E.g. Annual lifecycle emissions from Prudhoe bay production have increased since divestment. ↩︎
IEA (2021) Net zero by 2050: A roadmap for the global energy sector. ↩︎
BPX Energy’s interests in the San Juan basin were sold to IKAV in 2020 (Annual report 2020, p.177). It is in the process of divesting legacy assets in Wyoming, Colorado, Oklahoma and New Mexico ↩︎
Upstream Energy explored (2022) Azule Energy: new Eni and BP joint venture in Angola will be country’s largest producer ↩︎
Reuters.com (2021) BP, Eni seek to raise $2 bln for Angola joint venture, BP Group results 4th quarter and full year 2021 Q&A transcript. ↩︎
Marketscreener.com (2022) Exclusive-BP, Eni clinch deal on Angola joint venture ↩︎
Reuters.com (2020) BP poised to sell 'stranded assets' even if oil prices rally ↩︎
Reuters.com (2021) Iraq approves BP plan to spin off giant Rumaila oilfield ↩︎
ACG is producing 140 kboe/d of oil and gas (BP share) and Shaz Deniz 0.62bcf/d of gas and 3kb/d condensate (BP share) which would have a significant impact towards BP’s hydrocarbon production reduction target and BP’s emissions reduction target. ↩︎
Sanyal, D. (2020) BP Week low carbon electricity energy ↩︎
Hydrogen Council (2020) Path to hydrogen competitiveness. Steam methane reforming (SMR) can capture 60-90%, autothermal reforming (ATR) can capture up to 95%. ↩︎
Brecha et al (2022) https://doi.org/10.21203/rs.3.rs-599934/v1. This research is pre-print: it is in review phase, and will be published once the peer review process is concluded. ↩︎
TCFD (2017) Recommendations of the Task Force on Climate-related Financial Disclosures ↩︎
SBTi (2022) Guidance for the oil and gas sector ↩︎
Hydrogen Council (2020) Path to hydrogen competitiveness. ↩︎
Timmerberg, S. et al (2020) https://doi.org/10.1016/j.ecmx.2020.100043 ↩︎
IEA (2021) Net zero by 2050: A roadmap for the global energy sector. ↩︎
BP (2021) Energy outlook for hydrogen use by region (retrieved from web.archive.org) ↩︎
NASA (2019) The Atmosphere: Getting a Handle on Carbon Dioxide. ↩︎
The remaining CO2e carbon budget to stay below 1.5C global warming with a 83% likelihood is calculated using the
relationship between cumulative CO2 emissions and cumulative greenhouse gases based on the scenarios from IPCC (2018):
Global Warming of 1.5°C, https://www.ipcc.ch/sr15/ . See explanatory note under section 6.0 Definitions; Remaining carbon
budget (CO2e)). ↩︎
Sanyal, D. (2020) BP Week low carbon electricity energy ↩︎
BP (2022) BP 4Q21 results presentation, slide 20 ↩︎
IEA (2021) Net zero by 2050: A roadmap for the global energy sector. Figure 2.09 ↩︎
IEA (2019) The future of hydrogen ↩︎
IEA (2021) Net zero by 2050: A roadmap for the global energy sector. Figure 2.19 ↩︎
Based on 1GW power output and 50% fuel cell efficiency factor (US Department of Energy) ↩︎
UK Government (2021) UK Hydrogen strategy ↩︎
Hydrogen council (2020) Path to hydrogen competitiveness, p.13,\ ↩︎
Hydrogen council (2020) Path to hydrogen competitiveness, p.21 ↩︎
Sanyal, D. (2020) BP Week low carbon electricity energy ↩︎
Based on 1GW power output and 50% fuel cell efficiency factor (US Department of Energy) ↩︎
GHD Advisory (2020) Renewable Hydrogen and Ammonia Feasibility Study ↩︎
Timmerberg, S. et al (2020) https://doi.org/10.1016/j.ecmx.2020.100043; Blank et al (2020) Hydrogen’s Decarbonization Impact for Industry. ↩︎
BP (2022) BP 4Q21 results presentation, slide 21 ↩︎
Global production is global supply of biomethane and modern liquid bioenergy as defined in the IEA NZS. ↩︎
Bp mentions 26kb/d ethanol equivalent when including biopower and refinery co-processing volumes. BP 4Q21 results, slide 30 ↩︎
Sanyal, D. (2020) BP Week low carbon electricity energy ↩︎
BP (2022) BP 4Q21 results presentation, slide 30\ ↩︎
BP (2022) BP 4Q21 results presentation, slide 30 ↩︎
BP (2022) BP Group results 4th quarter and full year 2021 ↩︎
BP (2019), SAF explained ↩︎
BP (2022), Nuseed will supply BP with Carinata oil for the production of SAF and other biofuels ↩︎
Prnewswire.com (2021) Fulcrum BioEnergy Completes Construction of the Sierra BioFuels Plant ↩︎
Fulcrum’s supply capacity of its first biorefinery is ~0.17kb/d. Neste is expanding its capacity from 2.1kb/d to 32kb/d in 2023, with BP is one of many customers. ↩︎
IEA (2021) Net zero by 2050: A roadmap for the global energy sector. Table 2.8 and figure 3.6 ↩︎
Sanyal, D. (2020), BP Week low carbon electricity energy ↩︎
Bp Bunge Bioenergia has committed to a non-deforestation value chain by 2025. ↩︎
Beacham, T.A. et al (2017) https://doi.org/10.1016/j.algal.2017.04.028 ↩︎
The Digest (2015) BP’s exit from cellulosic ethanol; The Yorkshire Post (2015) BP sells stake in Vivergo to ABF ↩︎
Units (kb/d) are on an ethanol equivalent basis ↩︎
BP (2019), SAF explained ↩︎
Neste (2020) Neste and Air bp to offer increased volume of sustainable aviation fuel in Europe ↩︎
BP (2022), Nuseed will supply BP with Carinata oil for the production of SAF and other biofuels ↩︎
Qantas (2021) Qantas purchases sustainable aviation fuel for kangaroo route ↩︎
BP (2022) 4Q 2021 Group databook ↩︎
BP (2022) BP 4Q21 results presentation, slide 20 ↩︎
IEA (2021) Net zero by 2050: A roadmap for the global energy sector p.117 and figure 3.11 ↩︎
BP (2022) BP Group results 4th quarter and full year 2021 ↩︎
Based on BP’s efficiency factors for renewable energy ↩︎
BP (2021) Q3 2021 results Q&A ↩︎
IEA (2021) Net zero by 2050: A roadmap for the global energy sector figure 3.9 ↩︎
BP (2020) BP and Amazon deepen their successful relationship\ ↩︎
Financial Times (2021) BP targets US retail power market with cleaner fuel mix ↩︎
Reuters (2021) BP-backed UK energy supplier Pure Planet close to collapse and Pure Planed Ltd ↩︎
BP (2019) BP and DiDi join forces to build electric vehicle charging network in China ↩︎
Netzerotesside (2021) Funding secured to accelerate development of UK’s first decarbonised industrial clusters on the east coast of England ↩︎
BP (2014) BP response to the Tangguh independent advisory panel ↩︎
Gasworld.com (2021) Tangguh LNG project drives forward after CCUS approval ↩︎
BP (2020) Australia’s Technology Investment Roadmap, BP submission ↩︎
Olea, R.A. (2015) https://doi.org/10.1016/j.petrol.2015.03.012 ↩︎
Global CCS Institute (2021) Global status of CCS: 5.1 Commercial CCS facilities and projects ↩︎
Santos (2020) Climate Change report ↩︎
E3G (2021) Hydrogen: factsheet series. ↩︎
Olea, R.A. (2015) https://doi.org/10.1016/j.petrol.2015.03.012 ↩︎
Climate policy watcher (2021) Efficiency parameters of CCS. ↩︎
Robert Howart & Mark Jacobson (2021) How green is blue hydrogen? ↩︎
Oxford dictionary definition ↩︎
Zickfeld, K. et al (2021) https://doi.org/10.1038/s41558-021-01061-2 . ↩︎
BP (2021) bp esg investor pack march 2021 ↩︎
BP (2020) Sustainability report 2020 ↩︎
Wall Street Journal, 2020, https://webreprints.djreprints.com/4933210643356.html ↩︎
BP (2022) Our carbon offset project portfolio ↩︎
BP (2022) Our carbon offset project portfolio ↩︎
BP (2021) BP annual report 2020, p.320 ↩︎
Wall Street Journal (2020) https://webreprints.djreprints.com/4933210643356.html ↩︎
Stockholm Environment Institute (2016) How additional is the Clean Development Mechanism. ↩︎
Woodland Trust (2019) Life cycle of a tree: how trees grow ↩︎
Mackey, B. et al (2013), https://doi.org/10.1038/nclimate1804 ↩︎
Seddon et al (2020) Understanding the value and limits of nature-based solutions to climate change and other global challenges. ↩︎
Based on 1GW power output and 50% fuel cell efficiency factor (US Department of Energy) ↩︎
GHD Advisory (2020) Renewable Hydrogen and Ammonia Feasibility Study ↩︎
Get email updates about new ACCR research and shareholder advocacy on specific topics of interest to you.
Sign Up