This communication is for informational purposes only and does not constitute financial, legal, or professional advice. ACCR does not hold an Australian Financial Services Licence and does not provide financial product advice. The purpose of this communication is not to provide financial product advice. Please read the terms and conditions attached to the use of this site.
BHP disclosed a deferral that should have moved its expected emissions pathway. It hasn’t explained why it didn’t.
BHP's 2024 Climate Transition Action Plan (CTAP), which received 92% shareholder support, set out its expected operational decarbonisation pathway and the investments intended to support it. Since then, BHP has deferred significant fleet electrification and other decarbonisation projects. Its FY2026 Annual Report provides investors with the first updated emissions pathway since those delays.
While the near-term numbers moved, the shape of BHP's longer-run expected pathway didn't. Its 16 September ESG Roundtable presentation implied 2035 emissions would be around 33% higher than under its previous plan - consistent with the deferral, and roughly in line with independent media estimates. The expected pathway remains close to its 2024 equivalent. BHP does not explain what closes that gap, or why a near-term increase of this scale leaves its long-run trajectory looking largely unchanged.
Some investors have taken BHP's disclosure of the deferral as sufficient in itself. Transparency about the delay isn't the same as consistency between that delay and the numbers BHP disclosed afterwards.
With BHP's FY2030 operational emissions target effectively achieved and no company-wide operational emissions target until 2050, investors need greater clarity on what will deliver the emissions reductions BHP now expects - and what will provide accountability for the decisions made over the next two decades.
Key points
- BHP deferred major decarbonisation projects. Its Expected Pathway to net zero by 2050 barely moved. BHP does not explain what now delivers the abatement those projects were meant to provide.
- BHP has effectively hit its FY2030 target. It has no further company-wide operational emissions target until 2050 - a 20-year gap while the decisions that will set emissions through the 2030s and 2040s are being made now.
- A seven-year delay scenario increases BHP's potential cumulative carbon liabilities by roughly a third - from US$11.6–19.4 billion under BHP's own pathway to US$15.4–25.6 billion under ACCR's modelling.
- BHP's Best-case Pathway is now worse than in 2024: roughly 25 MtCO2-e more cumulative emissions to 2050, and residual emissions in 2050 have roughly doubled.
- BHP's planning range now implies 2.2–2.5°C of warming by 2100, up from ~2°C in FY2025. BHP says this informs strategy and investment decisions. It does not disclose how.
Key questions for investor engagement
- What will now deliver the emissions reductions previously expected from the projects BHP has deferred, and why has its Expected Pathway barely changed despite those delays?
- BHP’s 16 September ESG Roundtable provided materially more detail about the technical and operational challenges facing fleet electrification, including a confirmed ~1,000-hour annual productivity loss per battery-electric truck. Why has that additional detail not moved the pathway or widened the range of uncertainty around it?
- What drives the projected increase and subsequent decline in fugitive methane emissions at BMA? When does BHP expect meaningful abatement to begin, and is the current pace of its characterisation and trial work sufficient to deliver it?
- How materially do Fuel Tax Credits affect the economics and timing of diesel displacement, and how would BHP’s investment decisions change if this were reduced or removed?
- How has the move to a higher-warming planning range affected BHP’s strategy, capital allocation and investment decisions?
- What milestones and investment decisions will demonstrate progress through the 2030s, including fleet electrification, enabling infrastructure and fugitive methane abatement?
- With the FY2030 target effectively achieved, what provides the medium-term investment signal and accountability mechanism for operational decarbonisation through the 2030s?
Analysis
1. BHP’s Best-case Pathway has weakened, while its Expected Pathway has barely changed
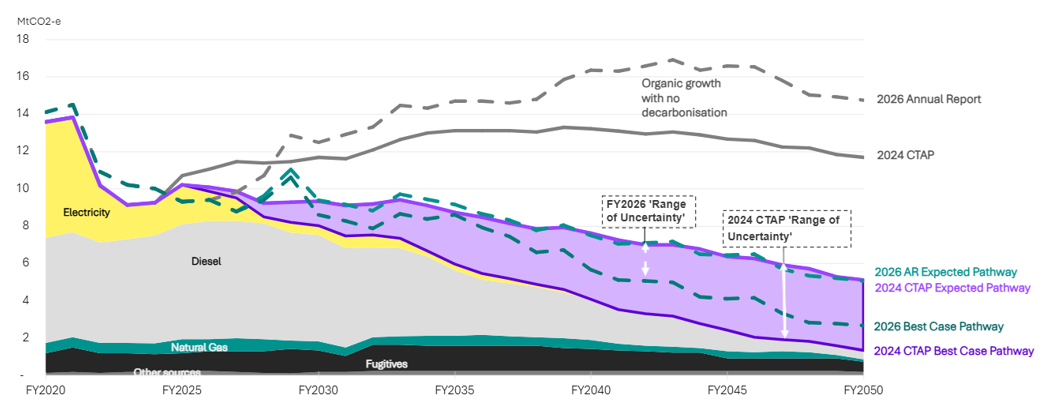
BHP’s FY2026 Annual Report provides its first updated potential operational emissions pathway since it deferred significant fleet electrification and other decarbonisation investments. BHP presents a central emissions trajectory together with a ‘range of uncertainty’ below that trajectory. For clarity, ACCR refers to the upper boundary of this range as BHP’s ‘Expected Pathway’ - its current expectation for how operational emissions could decline to 2050 - and the lower-emissions boundary as its ‘Best-case Pathway’, a more ambitious abatement outcome. The gap between the pathways represents BHP’s disclosed range of uncertainty.
The update shows a counterintuitive result (Figure 1). BHP’s Best-case Pathway has shifted materially higher than its 2024 CTAP equivalent, consistent with the deferral of major decarbonisation projects. Yet the FY2026 Expected Pathway remains close to its 2024 CTAP equivalent, narrowing the range between the two pathways. BHP does not explain why its Expected Pathway remains largely unchanged, or why the range between the two has narrowed, given how much uncertainty remains over future technology deployment and abatement.
BHP’s September 2026 ESG Roundtable provides further evidence that significant deployment challenges around fleet electrification remain unresolved for BHP. BHP quantified the potential productivity impact of static charging, confirmed further dynamic-charging trials in FY2027 and said its focus remains on proving when and how electrification technologies can be deployed safely, reliably and efficiently.
These challenges are not new. In 2023, BHP identified direct electrification as its preferred pathway to eliminate diesel and expected battery-truck operating costs to be comparable with diesel, while acknowledging that charging could require additional truck hours and further operational trials. Three years later, these issues remain unresolved and large-scale fleet electrification has been deferred beyond FY2030, demonstrating the continuing uncertainty around BHP’s plan for when and how this abatement will be delivered. Against this backdrop, BHP’s materially narrower FY2026 range of uncertainty warrants further explanation.
FIGURE 1: BHP’S 2024 CTAP NET ZERO TRAJECTORY COMPARED WITH ITS FY2026 ANNUAL REPORT UPDATE
Sources: ACCR analysis, BHP company disclosures
Key changes in the trajectory observed by ACCR
- BHP’s Best-case Pathway now results in substantially higher emissions. ACCR estimates that BHP’s FY2026 Best-case Pathway results in approximately 25 MtCO2-e more cumulative emissions between FY2025 and FY2050 than the equivalent pathway in its 2024 CTAP.
- BHP’s range of uncertainty has narrowed by around 50%. The gap between its Expected and Best-case pathways is approximately 1.5 MtCO2-e per year smaller on average than in the 2024 CTAP - a materially narrower range of potential outcomes, despite continuing uncertainty over the technologies and deployment required to deliver it. BHP does not explain the basis for the narrower range.
- The largest near-term change occurs immediately before FY2030. BHP’s FY2026 pathway shows emissions rising in FY2029, before declining again in FY2030 - an apparent spike in electricity emissions that BHP does not explain, including how it relates to the delivery of its FY2030 target.
- More diesel emissions remain for longer in BHP’s Best-case Pathway. Compared with the 2024 CTAP, the FY2026 Best-case Pathway retains considerably more diesel through the 2030s and 2040s. BHP provides no equivalent breakdown of its Expected Pathway by source, so it is not possible to determine how diesel abatement has changed within that pathway.
- Fugitive methane emissions remain higher later in the FY2026 pathway. They’re lower than under the 2024 CTAP pathway during parts of the 2030s, but materially higher through the 2040s before declining towards 2050.
- Around twice as many emissions may remain to be offset in 2050. Residual emissions in the Best-case Pathway increase from around 1.5 MtCO2-e under the 2024 CTAP to around 3 MtCO2-e under the FY2026 pathway - doubling the minimum amount that may need to be offset to reach net zero.
2. Delayed abatement increases cumulative emissions and potential carbon costs
The timing of emissions reductions matters. Even where emissions reach similar levels in the long term, delaying structural abatement increases cumulative emissions over the intervening period and can increase BHP’s exposure to future carbon costs.
BHP has disclosed delays to major operational decarbonisation projects since its 2024 CTAP, including large-scale diesel displacement beyond FY2030. BHP’s FY2026 pathway should have given investors greater visibility into what those delays mean for its emissions. Instead, as section 1 shows, these project deferrals are not reflected in a corresponding increase in its Expected Pathway or an alternative explanation.
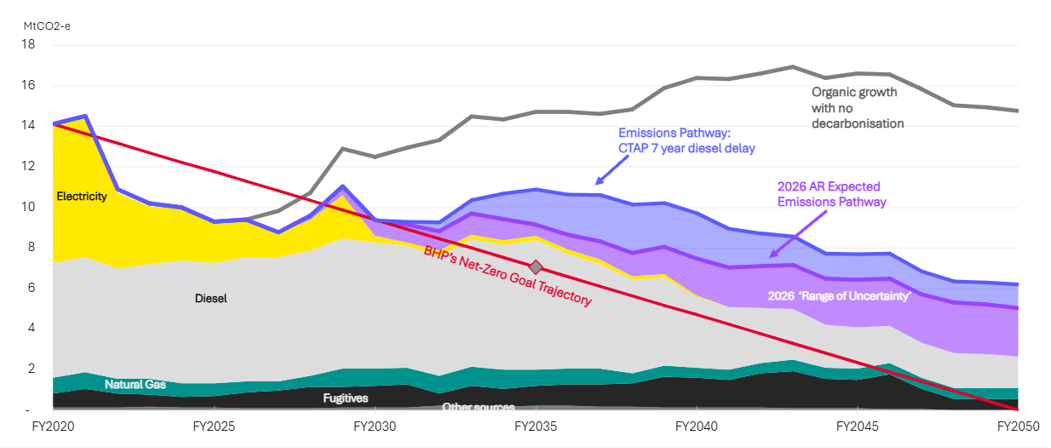
ACCR therefore modelled an illustrative seven-year delay to the structural abatement in BHP’s 2024 CTAP pathway - the last pathway BHP disclosed before announcing the project delays - and compared the results with BHP’s FY2026 Expected Pathway (Figure 2).
The seven-year scenario is intended to be conservative. Haul trucks typically have replacement cycles of around 14 years, and BHP has stated that it expects existing diesel-powered equipment to be replaced at the end of its useful life through regular fleet renewal programs. This scenario therefore illustrates the potential consequences of later structural abatement without assuming a full 14-year replacement cycle of delay.
The scenario should not be interpreted as BHP having disclosed a seven-year delay across its decarbonisation program, nor is it intended to replicate BHP’s FY2026 Expected Pathway. Rather, it provides investors with a sensitivity against which to assess the emissions and financial consequences of later abatement and compare these with the pathway BHP now expects to deliver.
FIGURE 2: BHP’S FY2026 EMISSIONS TRAJECTORY AND ACCR’S SEVEN-YEAR DELAY SCENARIO
Sources: ACCR analysis, BHP company disclosures
Delay increases both cumulative emissions and Safeguard Mechanism exposure
Under ACCR’s seven-year delay scenario, BHP would emit approximately 29 MtCO2-e more operational emissions cumulatively from 2031 to 2050 than under its 2024 CTAP pathway, an increase of approximately 19%. This difference is material. The additional 29 MtCO2-e is equivalent to approximately three years of BHP’s current annual operational emissions.
The implications are also financial. A substantial proportion of BHP’s Australian operational emissions are covered by Australia’s Safeguard Mechanism (SGM), which sets emissions baselines for large industrial facilities that decline over time (currently by 4.9% per annum to FY2030). Facilities that exceed their applicable baseline must manage the excess, including through eligible Australian Carbon Credit Units or Safeguard Mechanism Credits generated by other facilities that outperform their baselines.
As these baselines decline, delayed structural abatement widens the potential gap between BHP’s emissions and its allowable emissions, increasing the volume potentially exposed to a compliance cost.
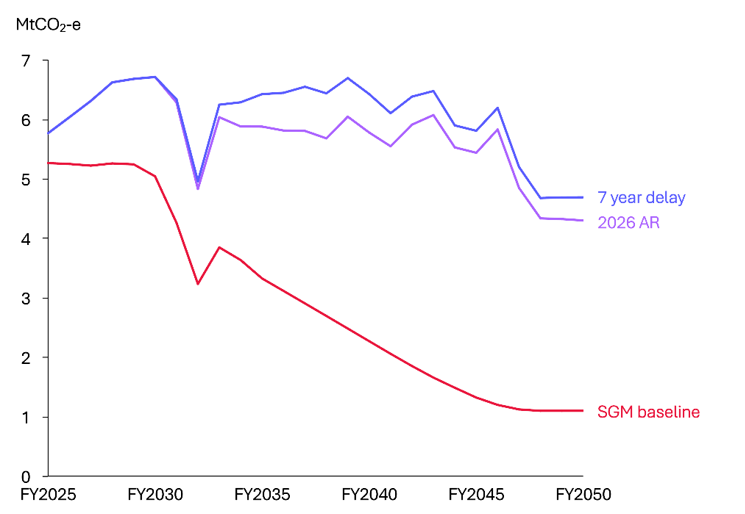
ACCR estimates potential SGM exposure by comparing projected emissions from BHP’s Australian covered facilities with estimated facility baselines in each year to 2050 (Figure 3). The cumulative difference between emissions and those baselines provides an estimate of the volume potentially requiring compliance.
On this basis, ACCR estimates that BHP’s covered emissions could exceed estimated SGM baselines by approximately:
- 60 MtCO2-e cumulatively to 2050 under the 2024 CTAP pathway
- 71 MtCO2-e under BHP’s FY2026 Expected Pathway
- 80 MtCO2-e under ACCR’s seven-year delay scenario
The approximately 11 MtCO2-e liability increase between BHP’s 2024 CTAP and FY2026 Expected Pathway is primarily attributable to higher forecast fugitive methane emissions, highlighting the potential financial significance of BHP’s growing methane challenge.
FIGURE 3: BHP’S EMISSIONS COMPARED WITH ESTIMATED SAFEGUARD MECHANISM BASELINES
Sources: ACCR analysis; BHP company disclosures; NB: Current SGM design applied FY2025-30. FY2031 onwards assumes decline rate of 3.29% p.a; min. baseline of 100,000 tCO2-e; facilities remain eligible for up to five years following closure or continued temporary suspension. Existing facility emissions intensity values assumed for future sustaining and growth tonnes; Australian operational emissions covered under SGM - Assumes Nickel WA remains in suspension and Saraji South restarts H2 FY2029.
Delays could materially increase carbon liabilities
ACCR has modelled the potential financial implications of BHP’s emissions pathways by estimating the combined cost of Australian Safeguard Mechanism compliance and offsetting residual Group operational emissions to meet BHP’s net zero goal in 2050 (Figure 4).
For Australian facilities covered by the Safeguard Mechanism, ACCR estimates the annual emissions above applicable facility baselines and applies a range of projected ACCU prices to this excess. For residual Group emissions, ACCR applies BHP’s disclosed internal carbon-price assumptions to estimate potential offset costs. The lower and upper estimates reflect the range of ACCU and BHP carbon-price assumptions set out below.
Under these assumptions, potential cumulative carbon liabilities to FY2050 are estimated at approximately US$11.6-19.4 billion under BHP’s FY2026 Expected Pathway, compared with US$15.4-25.6 billion under ACCR’s seven-year delay scenario, an increase of approximately 32-33%.
Deferring capital expenditure in the near term does not necessarily avoid cost. Where structural abatement is delayed, BHP may instead increase its cumulative emissions and exposure to future carbon liabilities.
FIGURE 4: ESTIMATED COMPLIANCE SGM CREDITS, GROUP VOLUNTARY CARBON COSTS, 100% OPERATED
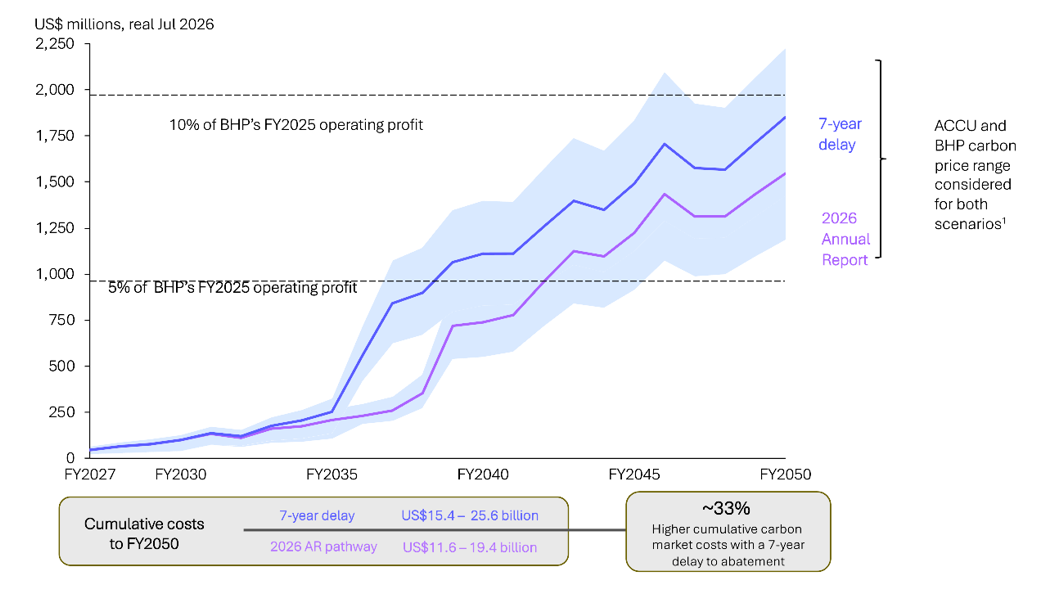
Sources: ACCR analysis, BHP company disclosures. Note: Estimated carbon liabilities (1) potential Australian Safeguard Mechanism compliance costs, calculated by applying projected ACCU prices to estimated emissions above applicable facility baselines; and (2) potential costs of offsetting residual Group operational emissions to meet BHP’s net zero goal, calculated using BHP’s internal carbon-price assumptions. The range reflects lower and upper bound carbon price assumptions: ACCU prices of FY30: US$24-78 t/CO2-e, FY50: US$93-195 t/CO2-e; and BHP internal carbon prices of FY30: US$30-88 t/CO2-e, FY50: US$176-250 t/CO2-e (real July 2026). BHP internal carbon prices based on 2024 CTAP Australian region, except for where prices fall outside of 2026 Annual Report price range. The carbon price range stated in 2026 Annual Report is inclusive of all key customer regions, including the EU, and does not provide regional prices. Analysis does not include voluntary compliance costs outside of Australia.
3. Fugitive methane remains a growing challenge at BMA
BHP’s FY2026 reporting shows that fugitive methane emissions at BMA are increasing. Across BMA’s current coal mines, fugitive emissions increased by approximately 27% in FY2026, from 0.85 MtCO2-e to 1.08 MtCO2-e. BHP attributes higher emissions to increased material movement and mining in more methane-intensive areas, which also raised emissions intensity per unit of production.
This increase is occurring while BHP’s open-cut methane mitigation work remains largely at the characterisation and trial stage. Its gas resource drilling and analysis program commenced in FY2025, with data analysis and modelling expected to continue into FY2028 before informing BMA’s methane management strategy. BHP has also begun a trial of an open-cut methane drainage technique, which is testing its operability, technical effectiveness and commercial viability.
BHP acknowledges that there are currently no proven technologies available at scale to abate fugitive methane from open-cut mines. It says it seeks to reduce fugitive emissions to the greatest extent that is “technically and commercially viable” and does not expect to fully eliminate BMA fugitive methane by 2050 under current technology and operational constraints. However, it does not explain what “commercial viability” actually means here, including how avoided emissions, potential carbon costs and Safeguard Mechanism exposure factor into that assessment.
BHP’s FY2026 Expected Pathway nevertheless shows fugitive emissions approximately doubling from current levels by the mid-2040s before declining towards 2050. For investors, this raises questions about what drives the projected increase, what enables the subsequent decline, when meaningful abatement is expected to begin and whether the pace of BHP’s current work is sufficient to deliver it. More broadly, methane highlights the challenge identified throughout this bulletin: significant future emissions reductions are assumed, but investors have limited visibility over how they will be delivered.
Engagement questions
- What drives the projected increase and subsequent decline in BMA fugitive emissions, including the respective contributions of production, mine mix, emissions intensity and methane abatement?
- What methane abatement, if any, is assumed in BHP’s Expected Pathway and when is it expected to be deployed at scale?
- How does BHP define “commercial viability” for fugitive methane abatement and what factors are incorporated into that assessment? For example, does this mean fugitive methane abatement opportunities have to compete for capital in BHP’s capital allocation process?
- How are the emissions and potential carbon costs associated with more methane-intensive mining incorporated into operational and investment decisions at BMA?
4. Fuel Tax Credits may weaken the investment signal for diesel displacement
Australia’s Fuel Tax Credit (FTC) scheme refunds fuel taxes to eligible businesses, including diesel consumed in off-road mining operations. The scheme is under scrutiny as it contributes to billions in federal government spending each year. The Parliamentary Budget Office recently found that an A$50 million annual cap on diesel Fuel Tax Credits, if introduced five years ago, would have generated an estimated A$5 billion in government revenue. BHP remains a significant beneficiary of the scheme, lowering the cost of diesel used across BHP’s Australian operations.
Recent analysis by Climate Integrity estimates that BHP’s diesel consumption increased from 1.23 billion litres in FY2025 to 1.25 billion litres in FY2026, on an equity basis. It estimates BHP will receive approximately A$548 million in FTCs for FY2026.
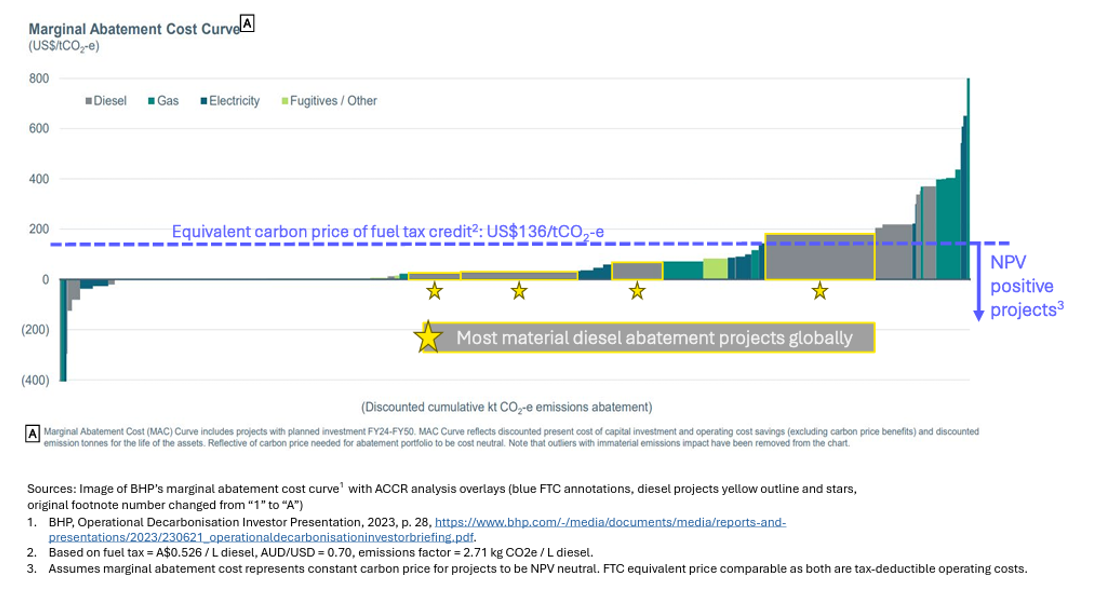
The scale of these credits is relevant to BHP’s decarbonisation decisions because they improve the relative economics of continued diesel use. ACCR’s July analysis found that the FTC effectively reduces the operating cost of diesel by an amount equivalent to a carbon price of approximately US$136/t CO2-e and that most of BHP’s fleet electrification projects become financially viable with the removal of FTCs (Figure 5).
This matters more now that BHP has deferred large-scale fleet electrification beyond FY2030. FTCs keep the cost of continued diesel use artificially low, at the same time BHP is assessing when and where to deploy capital to replace diesel equipment, potentially weakening the investment signal for earlier structural abatement.
The Australian Government considered changes to FTCs for large mining companies ahead of the May 2025 Budget, before deciding not to proceed at that time amid fuel-security concerns. Reform proposals remain under political and policy consideration, including debate over whether the scheme is appropriately aligned with Australia’s emissions-reduction objectives. The FTC provides a signal against fleet decarbonisation at a time when critical, long-lived fleet decisions are being made.
FIGURE 5: BHP’S MARGINAL ABATEMENT COST CURVE OF PLANNED ABATEMENT PROJECTS FROM 2025 TO 2050
5. BHP is planning for a higher-warming world
BHP has materially revised the assumptions underpinning its long-term planning. Its FY2026 planning range now implies approximately 2.2 - 2.5°C of global warming by 2100, compared with approximately 2°C in FY2025, reflecting what BHP describes as an updated assessment of global decarbonisation pathways.
The change is relevant because BHP’s planning range is not simply a climate scenario. BHP describes it as its long-term forecast for demand, supply and prices across its commodities and uses it for operational planning, strategy formation and investment decisions. The planning range and associated assumptions are also reflected in internal valuations underpinning its financial statements.
A 2.2 - 2.5°C world also carries materially greater and more complex climate risks. The IPCC finds that risk increases with every increment of warming; risk associated with large-scale tipping points moves from moderate to high between 1.5°C and 2.5°C. At 2.5°C, multiple categories of climate risk are transitioning towards very high levels - including irreversible changes to major climate and ecological systems, and physical impacts that compound and cascade through infrastructure, supply chains and economies.
BHP does not clearly disclose what its higher-warming planning range has changed in practice. Investors cannot readily see how the revised assumptions have affected BHP’s valuations, portfolio strategy, capital allocation or investment decisions, or how BHP is accounting for the greater physical and economic risks associated with the higher-warming world it now plans around.
Engagement questions
- How has the revised planning range affected BHP’s valuations, portfolio strategy, capital allocation and investment decisions?
- How is BHP accounting for the greater physical, economic and systemic risks associated with the higher-warming world now reflected in its planning range?
6. A medium-term accountability gap remains
BHP has effectively achieved its FY2030 operational emissions target several years early, largely through reductions in scope 2 emissions. Between FY2020 and FY2026, BHP's scope 2 emissions declined by 77%, while scope 1 emissions increased by 3%, leaving diesel and fugitive methane as major components of its remaining operational decarbonisation challenge.
This has implications for the investment signals embedded in BHP's own capital allocation framework. BHP classifies operational GHG emissions reduction projects within the maintenance capital category of its Capital Allocation Framework and says critical projects are priorities, including those that contribute to its medium-term target. With that target effectively achieved, however, BHP has no further company-wide operational emissions target until its net zero goal in 2050 - a 20-year gap.
Without a meaningful forward target, what creates the medium-term imperative to deploy capital for structural decarbonisation? Particularly where projects compete with other calls on capital, like growth capital, or don't meet conventional investment hurdles?
Many of the decisions that will determine BHP's operational emissions through the 2030s and 2040s are being considered or made now. Fleet replacement, enabling infrastructure, mine development and methane abatement involve long lead times and significant capital requirements. As this analysis demonstrates, delaying structural abatement can increase cumulative emissions and potential carbon costs.
Investors need to understand what will drive capital allocation and management accountability for structural decarbonisation through this period, the medium-term outcomes against which progress will be measured, the implementation milestones required to assess delivery and how capital allocation and executive accountability support those outcomes. BHP's own Capital Allocation Framework prioritises projects that contribute to a medium-term target. There is currently no target to drive the accountability needed in the 20 years between FY2030 and 2050.
Engagement questions
- Will BHP establish a medium-term operational emissions target, supported by a cumulative emissions budget, to provide accountability for emissions and capital allocation decisions beyond FY2030?
- What fleet replacement timelines and implementation milestones will BHP disclose to allow investors to assess progress on diesel displacement through the 2030s?
- How is BHP ensuring that enabling infrastructure, renewable energy investment and operational readiness progress alongside the deployment of fleet electrification and other structural abatement?
- How will BHP align its Capital Allocation Framework and executive incentives with delivery of operational decarbonisation beyond FY2030?
Download a PDF of BHP’s plans have changed. Its expected emissions pathway hasn't.