22nd October 2021
Publication Information
Download Publication
- 4 MB PDF
- 22nd October 2021
Stay Informed
Get email updates about new ACCR research and shareholder advocacy on specific topics of interest to you.
Sign UpTo form a view on RDS’ current climate strategy, we estimated RDS’ historical 30-year emissions profile by incorporating data from RDS and the Carbon Accountability Institute. Using assumptions based on RDS’ recent disclosures (FY16 to FY20), we have estimated the contribution of 3rd-Party Products, RDS’ historical product mix, and fuel carbon intensities.
Based on this analysis, in the last 30 years (FY1990 to FY2020), RDS’ emissions have ranged from ~1.4 Gt to 1.8 Gt CO2e p.a. This includes direct emissions from its own operations (Scope 1), indirect emissions from purchased energy (Scope 2), and other indirect emissions from the value chain and end use (Scope 3, Own Production and 3rd-Party Products). RDS excludes Scope 3 emissions from non-energy products such as chemicals, lubricants and trading. In FY20, Scope 3 GHG emissions comprised ~95% of the total 1,376 Mt CO2e reported.
RDS expects its total annual emissions to have peaked in FY18 at 1.7 Gt CO2e p.a. In our analysis RDS’ annual GHG emissions may have been even higher in FY2000 at ~1.8 Gt CO2e. Our analysis indicates that since FY2001, annual emissions declined 26% to reach 1.3 Gt CO2e in FY15, before increasing 24% by FY16 to ~1.6 Gt CO2e. This was driven by production growth with the acquisition of BG Group (increasing oil and gas production by ~25%).[1]
Chart: RDS GHG emissions (Gt CO2e) FY1990 - FY2020, Scopes 1, 2 and 3 energy products
Source: Company data, Carbon Accountability Institute estimates of RDS’ historical GHG emissions, Global Climate Insights estimates
Emissions are largely discussed on an annual basis - influenced by reporting protocols, disclosures, and alignment with financial statement analysis. While it is useful to understand year on year emissions performance, CO2 remains in the atmosphere for centuries.[2] It is the “stock” of emissions, not the “flow”, that really matters for climate outcomes.
Global cumulative emissions between 1750-2020 are estimated to be 3,864 Gt CO2e[3]. As of FY19, RDS has cumulatively produced an estimated 116.5 Gt CO2e in emissions (FY1892 to FY2019). RDS’ historical cumulative emissions have contributed to 3% of total GHG emissions. The company has had a sizable impact on the committed level of human-induced warming that has caused irreversible changes to the climate - the cost of which has yet to be fully reflected on its balance sheet or earnings.
Net zero in a particular year (or in 2050) alone will not ensure a safe climate. The pathway to reduce reliance on fossil fuels now, in preparation of growth opportunities in a zero emissions economy, should be the priority. Corporate boards should manage this risk in line with established risk management frameworks and escalation mechanisms. Every percentage reduction in absolute emissions made today will drive proportionately larger reductions in cumulative emissions.
Scientists estimate the remaining carbon budget, to stay on course for a 1.5oC warming of our climate, is around 620.4 Gt CO2e .[4] In the absence of absolute emissions reduction targets from RDS, we review four scenarios to understand how annual emissions may impact its cumulative impact. We found that under Scenario 1, if RDS maintains its FY19 emissions until FY50, it would produce cumulative emissions of 48.96 Gt CO2e, 7.9% of the remaining global carbon budget. If RDS were to reduce emissions from FY21 by 5% p.a, its footprint would almost halve to ~25.6 Gt CO2e, 4.1% of the remaining carbon budget. If a 5% p.a reduction was delayed by 10 years, its footprint would be ~35 Gt, 5.7% of the remaining carbon budget.
For the fourth scenario, we look at how RDS' current strategy - including portfolio mix, market share and carbon intensity targets - may translate into absolute emissions.
Although our analysis is formed using a number of assumptions (detailed in section 1.3 below), we estimate that under its current decarbonisation strategy, RDS will not reduce annual absolute emissions (pre-Carbon Capture Utilisation and Storage - CCUS/offsets) until FY30. Furthermore, we estimate that RDS will produce a cumulative footprint of ~53.3 Gt CO2e by FY50, 8.6% of the global carbon budget and the highest of all scenarios.
Table: RDS’ cumulative emissions scenarios
| 1. No action | 2. Linear decline | 3. Delayed action | 4. Current strategy | |
|---|---|---|---|---|
| (5% p.a decline) | (5% p.a decline from FY30) | (est. absolute emissions) | ||
| Cumulative absolute emissions (FY21-FY50) | 48,960 Mt | 25,634 Mt | 35,136 Mt | 53,331 Mt |
| Absolute annual emissions in FY50 | 1,632 Mt | 367 Mt | 556 Mt | 1,765 Mt |
| Highest absolute emissions (FY21-FY50) | 1,632 Mt (FY21) | 1,632 Mt (FY21) | 1,632 Mt (FY21) | 1,857 Mt (FY30) |
| % change to No Action scenario (cumulative emissions) | - | -48% | -28% | +9% |
| Cumulative emissions/remaining global carbon budget | 7.9% | 4.1% | 5.7% | 8.6% |
Source: Company data, IPCC 6th assessment report, Global Climate Insights estimates.
In FY20, RDS’ total emissions were 1,384 Mt CO2e, which declined by 16% from FY19 largely due to impacts from COVID-19 (oil and gas production declined 8%, LNG sales declined 6%). Scope 1 and 2 emissions were 72 Mt CO2e, a decrease from 80 Mt CO2e in FY19. These changes were largely driven by reduced capacity and divestments.
Included in Scope 1 were emissions from methane (CH4), contributing 67,000 tonnes (1.9 Mt CO2e)[5], a decline of 27% from FY19. We believe that there is a high degree of uncertainty around this data. Research suggests that methane emissions in various geological basins are higher than estimated by oil and gas companies and regulators, in particular in shale gas developments.[6] RDS should move away from using emission factors[7] for methane measurement and adopt more rigorous emission monitoring and verification systems.
Management of methane emissions is gaining increasing global focus, with the European Union and the United States expected to shortly announce a target to reduce methane by one-third by 2030.[8]
To successfully decarbonise, all companies must focus on maximising the reduction of absolute emissions today. Reduction in Scope 3 emissions (1,312 Mt CO2e) and methane emissions will be most material. Minimising methane emissions is particularly important, given that methane is a short-lived greenhouse gas with potent warming potential. Methane’s warming impact is 28-34 times more powerful than carbon dioxide over a 100-year period, but 84-87 times more powerful than carbon dioxide over a 20-year period.[9] By drastically reducing its methane emissions, RDS can contribute to near-term slowing of temperature increase.
To address Scope 3 emissions, key decarbonisation actions include reducing production (working with end users to substitute feedstocks and fuels), improving efficiency, or divestment of carbon intensive businesses.
We do not see divestment as a GHG emission reduction strategy in itself. We believe divestments should only represent a small percentage of a company's GHG emission footprint reduction. Sale agreements for oil and gas assets should consider wind-down and incorporate provisions for remediation, with companies providing warranties over the adequacy of these provisions. We note that current transactions do not include these obligations for sellers. Further work needs to be done on the criteria that should be included as part of a divestment strategy that materially results in emissions reduction in alignment with the Paris Agreement. We note that RDS recently announced the sale of its assets in the Permian Basin. We will assess the impact on emissions forecast post-completion in 4Q21.
Historically, Oil and Gas companies have provided investors with exposure to the oil price and global growth (including that from developing economies). The key risks to returns have traditionally come from oil price volatility, with exposure to geopolitical factors (mostly supply), economic shocks (demand, e.g. COVID-19), and poor safety and environmental management. Extracting maximum resources for the lowest cost has underpinned business models, thus cash generation is strong when the oil price is high. Over the last 5 years, ROE (a reflection of the capital intensity) has ranged from -12.1% to 10.6%, gearing between 23% to 43%, and dividend yields of 4.6% to 8.6%.
In order to exist in a decarbonising world, some Oil and Gas companies are seeking to broaden their focus and adopt a portfolio approach as integrated energy companies. The aspiration here is to be fuel agnostic, delivering the energy in demand at the time needed from a diversified portfolio of alternatives.
The chart below shows RDS' current segments: Upstream, Integrated Gas, Oil Products and Chemicals. We plot the FY20 Adjusted Earnings against our forecast emissions growth in the next 10 years. The bubble size represents FY20 GHG emissions Scope 1-3 (with illustrative Scope 3 for Chemicals), and we assume Oil Products emissions include all oil and gas sold by third-parties.
On our forecasts for emissions growth, GHG emissions from Integrated Gas are expected to grow ~66% in the next 10 years. Although accurate forecasts for Chemicals GHG emissions are unavailable, we believe that of RDS' existing segments, Upstream will be the only one that does not have a growing emissions profile. This is due to a decline in oil production.
Chart: RDS segments, FY20 Adjusted Earnings and GHG emissions (bubble size) vs 10 year emission growth outlook
Source: Company data, Global Climate Insights estimates. Chemicals GHG emissions illustrative only.
The bubble size represents FY20 segments GHG emissions (absolute)
Integrated Gas GHG emissions are forecast to grow ~60% in the next 10 years
To align with decarbonisation, RDS has announced a business model that is focused on three material drivers - LNG, hydrogen, and leveraging its large distribution network. In our view, these are the activities that will have the most impact on its future product mix.
Of RDS' key strategies, only one (distribution) is not highly reliant on post-emissions compensation with CCUS and/or carbon offsets, creating a risk that RDS' strategy will not result in absolute emission reductions.
Table: RDS’ decarbonisation strategy
| Strategy | RDS aspirations | ||
|---|---|---|---|
| LNG | |||
Carbon Offsets | RDS is the largest seller of LNG globally with 20% of the global market share. RDS has aspirations to grow its LNG capacity by 4% p.a until 2025, with transportation for “carbon neutral LNG” (LNG sold with carbon offsets). RDS is seeking to grow gas production to 55% of fossil fuel production by FY30, equivalent to ~4% Compound Annual Growth Rate (CAGR) from 2019. RDS will invest $4bn p.a in Integrated Gas, broadly in line with prior years. | ||
| Hydrogen | |||
CCUS | RDS is targeting a double-digit share of “clean” (gas with CCUS and renewable) hydrogen by FY30. Its gas-based production of hydrogen will be reliant on large amounts of CCUS. By FY35, production is projected to reach 9 Mt, yielding 56 Mt of CO2. Assuming 85-95% CCUS capture efficiency is achieved by FY35, RDS would need to sequester 48-54 Mt of CO2. This is double the 25 Mt p.a. provided in RDS’ ambitions. | ||
| Distribution | |||
None | RDS' distribution business sits within its Oil Products - Marketing segment. It plans to expand the distribution footprint of its retail outlets and convenience stores. It plans to focus on increasing power delivered to customers via increased electric vehicle (EV) charge points, growing to 0.5m by FY25 and 2.5m by FY30. The carbon content of the power delivered will be reliant on the fuel mix of local electricity supply, unless RDS commits to sourcing renewable energy exclusively. RDS will continue to focus on its premium fuels and lubricants. RDS is aiming for capex in Marketing of $3m p.a. |
Source: Company data, Global Climate Insights estimates
The table below summarises the key points of differentiation in RDS' business model transformation compared to BP. Underlying each part of its strategy are material assumptions about technology, demand, margins, and impact on emission reduction. Understanding which are most material to RDS will assist us in assessing its business transformation strategy.
Table: RDS’ decarbonisation strategy compared to BP
| More reliance | Less reliance |
|---|---|
| LNG liquefaction and gas. Retail distribution and artificial intelligence. Large and explicit use of CCUS and carbon offsets. Chemicals sector exposure. | Development of renewable energy generation. Material reductions in the production of oil. However, RDS has stated it expects no new exploration for fields post-FY25 and oil production to decline 1-2% p.a from its 2019 peak. |
Source: Company data, Global Climate Insights estimates
We believe RDS' plans to leverage its global network as an integrated energy provider, across wholesale and retail outlets, are an appropriate response to decarbonisation. However, we are concerned that its focus on LNG as a growth driver in a decarbonising economy may be misplaced. Both LNG and gas-based production of hydrogen have little ability to reduce absolute emissions. With growing global energy demand, a focus on these fuels may negate any progress RDS can make in reducing absolute emissions in the next 10-20 years. RDS may better use the associated capital and operational expenditures to build out non-fossil fuels and invest in smart technology for distribution.
The majority of growth in production and sales appears to be driven by expansion of LNG and gas-based production of hydrogen. We therefore see a risk that the growth outlined in RDS' transition strategy is still materially driven by fuels that will increase emissions, producing a growth strategy that does not truly align with a decarbonising world. The task to reduce absolute emissions will be left to the scaling up of renewable hydrogen (0.4% of RDS FY20 hydrogen), and how effectively RDS’ distribution business can deliver renewable electricity to its customers, thereby displacing fossil fuels. Our question is whether renewable hydrogen and distribution are receiving the level of investment and focus required for RDS' decarbonisation to succeed.
In section 1.6 we look at the issues with post-emissions compensation, on which RDS is highly reliant in order to continue production of gas and its legacy assets.
A key challenge for investors is to compare company GHG emission footprints and targets on a like for like basis. Within its footprint, RDS includes Scope 1, 2 and 3 GHG emissions for its energy business, and excludes Scope 3 emissions from chemicals, lubricants and trading activities. While further information is required from RDS to quantify the gap, we believe GHG emissions from chemicals and lubricants will form a material component on GHG emissions, particularly given the energy intensity of chemical production and end of use products (including incineration).
Table: RDS GHG emissions disclosed
| Emissions type | FY20 Mt CO2e |
|---|---|
| Scope 1 | 63 |
| Scope 2 (operational, market-based) | 9 |
| Scope 3 | 1,304 |
| Total emissions included in RDS targets | 1,376 |
| Methane emissions (Scope 1) | 1.9 |
| Emissions excluded from targets: | |
| Scope 3 for non-energy business | Not disclosed |
| Emissions from trading activities | Not disclosed. We see a risk from exclusion of trading and physically settled derivatives to customers. |
Source: Company data, Global Climate Insights estimates
The table below summarises RDS' emission reduction targets from FY25, which are primarily based on carbon intensity. From an FY16 baseline, the company is targeting a 20% reduction in carbon intensity by FY30, 45% by FY35, and 100% by FY50. RDS does not have any targets for absolute emissions, but has a “net” zero 2050 GHG emission target.
RDS’ carbon intensity targets are based on its FY16 carbon intensity of 79 g CO2e/ MJ. As at FY20, carbon intensity had reduced 5% to 75 g CO2e/ MJ, although 4% of this decline occurred in the last year and was likely influenced by COVID-19.
RDS is already operating within its stated methane intensity target of <0.2% (as percentage of sales), raising questions regarding methane measurements. RDS could reduce uncertainty around its reported methane emissions given that proven technology to quantify emissions around operations already exists.
RDS’ targets for FY35 and FY50 rely on “mitigation actions by customers such as carbon capture and storage and nature-based offsets”[10] in addition to its own use of CCUS and carbon offsets. Given the material reduction in RDS’ carbon intensity targets between FY30 and FY35 (an additional 25% expected over the five years), RDS will likely rely on customer mitigation to achieve its target.
Table: RDS’ emissions reduction targets
| Aim | Targets | Target type | FY25 | FY30 | FY35 | FY50 |
|---|---|---|---|---|---|---|
| 1 | Scope 1, 2, and 3 (energy business only) | Carbon intensity reduction on FY16 | - | 20% | 45%* | 100%* |
| 2 | Scope 1, 2, and 3 (energy business only) | Net Zero (absolute emissions less CCUS and carbon offsets) | - | - | - | zero |
| 3 | Methane | Methane intensity | <0.20% | - | - | - |
Source: Company data, Global Climate Insights estimates. * RDS appears to be relying on customer mitigation to achieve its FY35 and FY50 targets.
No. While RDS has stated that it expects absolute emissions to have peaked in FY18 at 1.7 Gt CO2e p.a, it has not made any commitment that absolute emissions will reduce further from FY20 levels in the next 10 years. In addition, our initial forecasts of RDS' GHG emissions profile indicate that due to its plans to increase LNG and hydrogen production, it will be difficult for absolute emissions to be reduced (see section 1.3).
Emissions reduction in the next 10 years is critical in keeping warming to 1.5°C. The fundamental requirement of any climate transition strategy must be to reduce absolute emissions in the near term. Management and boards must approach the need to decarbonise with the same level of rigour and urgency as any other business risk or regulatory issue.
Our analysis in section 1.1 indicates that the cumulative impact on emissions from delayed action is material; a 5% annual reduction in RDS’ absolute GHG emissions today could save 48% in cumulative emissions by 2050. Delaying this action for 10 years would limit this to 28%. Reduction targets must therefore address all material emissions and go beyond incremental short-term and intensity-based targets.
RDS has quantified and set targets against Scope 3 emissions from third-party sold energy (largely oil and gas), which represents a material (57%) share of total Scope 3 emissions. We would like to see this extended to non-energy products.
RDS has disclosed some activities it will undertake to reach its FY30 carbon intensity target. However, it has not quantified the expected impact of these measures. In this section we seek to understand how material each activity may be in reducing its carbon intensity and if there are any activities that may also reduce absolute emissions. We note that RDS has a more ambitious FY35 target to reduce its carbon intensity by 45%. No material detail has been provided on how this will be achieved.
Table: RDS commitments to reach its carbon intensity targets
| Year | RDS commitments | ||||
|---|---|---|---|---|---|
| FY25 | 7 Mt p.a of new LNG new capacity (20% growth on FY20) | ||||
| FY30 | Share of gas to increase to 55% of fossil fuel production Produce 8x more low-carbon fuels than FY20 Double-digit share of global clean hydrogen 120 Mt p.a of nature-based carbon offsets Doubling electricity sold from FY20 Delivering >50 million households equivalent renewable power | ||||
| FY35 | 25 Mt p.a of CCUS |
Source: Company data, Global Climate Insights estimates
To understand if RDS can meet its own intensity targets, we have forecast its GHG emission trajectory based on stated production ambitions and strategy. We have used RDS' own transition scenario, Sky 1.5, and data from the International Energy Agency to understand the size of the markets for each fuel type under a 1.5°C scenario. To account for outlier impacts of COVID-19 in FY20, we have used energy delivered in FY19 as a baseline.
The chart below illustrates the carbon intensities we have assumed in our analysis. This remains constant throughout the forecast period of FY21 to FY50. Post-emissions compensation technologies, such as CCUS and carbon offsets, are applied after gross emissions are calculated.
RDS: Emissions Intensity by Fuel type excluding use of CCUS (g CO2e/MJ)
Source: Company data, Global Climate Insights estimates
We have assumed the carbon intensity for hydrogen produced using gas as feedstock is 100 gCO2e/MJ. This is based on 12 kgCO2e/kgH2 using Steam Methane Reforming, which is one of the most common methods of hydrogen production today.[11] We note that the amount of gas needed to produce hydrogen can vary and materially impact its carbon intensity.
Carbon intensity for renewable hydrogen and renewables generation is assumed to be zero, although we note that some emissions may be generated from the production of renewable infrastructure (much like existing oil and gas assets). Other carbon intensities for Oil, Gas, LNG, Biofuels and Power (electricity generation ex-renewables) represent RDS’ average emissions intensities by fuel between FY16 and FY20.
By FY30, RDS’ total energy delivered is forecast to increase 25% on FY19, of which:
Oil production is forecast to decrease 20% from FY19 (-2% CAGR) to FY30. This compares to the IEA NZE 25% decline for oil consumption and 9% decline in energy consumption.[12]
RDS: Annual energy by fuel type (EJ), FY21 to FY50
Table: RDS’ percentage of annual energy by fuel type
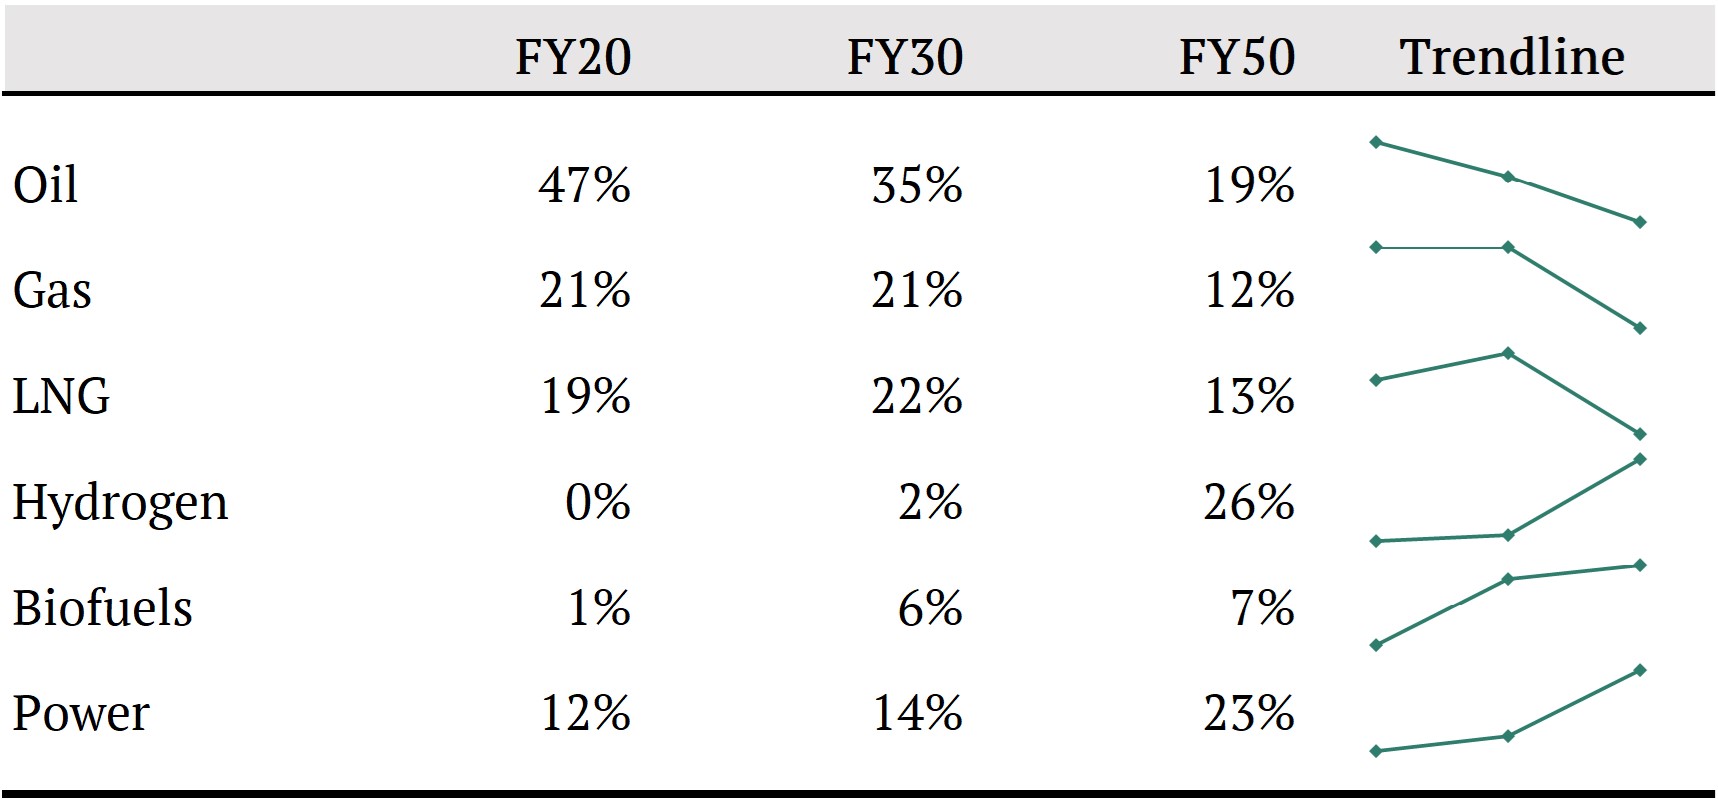
Source: Company data, Global Climate Insights estimates
From FY19, RDS’ total absolute emissions are forecast to grow 12.43% by FY30, reaching a peak of 1,857 Mt CO2e. This exceeds the company’s stated peak of 1.7 Gt in FY18.
The increase in absolute emissions is driven by RDS’ growth aspirations in gas and LNG. Between FY16 and FY30, the additional emissions produced by gas and LNG (238 MtCO2e) are forecasted to outpace the reduction in emissions produced by oil (-183 MtCO2e). Furthermore, ‘low-carbon’ fuels (hydrogen and biofuels) are a major driver of absolute emissions growth between FY19 and FY30, increasing emissions by 76 Mt CO2e p.a.
Our forecasts indicate that RDS will not be able to achieve the 45% reduction in net emissions required by the Hague District Court Dutch court by FY30, and will instead increase net emissions by 4.4%. We note our forecasts are sensitive to the assumptions for the intensity of gas hydrogen production and RDS’ renewable electricity production split. However, assuming half the intensity of gas hydrogen and double the proportion of renewable power delivered, RDS net emissions would reduce 1% from FY16.
RDS: Annual Emissions by fuel type (Mt CO2e), FY16 to FY50
Table: RDS’ percentage of annual absolute emissions by fuel type
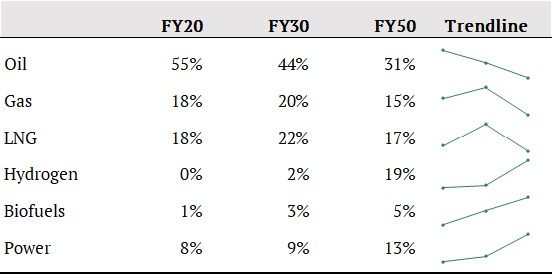
Source: Company data, Global Climate Insights estimates
A key question for investors is whether RDS will be able to meet its own carbon intensity targets based on its current strategy. We forecast RDS will be able to meet its targets in FY21 and FY22 only, and will not achieve its targets from FY23 to FY50.
Chart: RDS’ Net Carbon Intensity forecasts (gCO2e/MJ) vs reduction targets (%), FY19 to FY30
The table below summarises the forecasted carbon intensity of RDS products compared to its target, as well as the resulting absolute emissions.
Table: RDS’ forecast emissions reduction targets (includes CCUS and carbon offsets)
| Target type | FY21 | FY22 | FY23 | FY30 | FY35 | FY50 |
|---|---|---|---|---|---|---|
| RDS’ target carbon intensity reduction on FY16 | 2-3% | 3-4% | 6-8% | 20% | 45%* | 100%* |
| Carbon intensity forecast | 76.4 | 75.9 | 75.3 | 65.4 | 62.2 | 49.8 |
| Change on FY16 (%) | -3% | -4% | -4% | -17% | -21% | -37% |
| Achieve target? | Yes | Yes | No | No | No | No |
| Reduction from CCUS and carbon offsets (%) | -0.2% | -0.2% | -0.2% | -7% | -8% | -8% |
| Absolute emissions forecast | 1,650 | 1,662 | 1,677 | 1,857 | 1,843 | 1,765 |
| Change on FY16 (%) | +0.2% | +1% | +2% | +13% | +12% | +7% |
| Change on FY19 (%) | -0.2% | +1% | +1% | +12% | +11% | +7% |
| Net emissions change on FY19 (%) | -0.3% | +0.3% | +1% | +4% | +3% | -2% |
Source: Company data, Global Climate Insights estimates * RDS appears to be relying on customer mitigation to achieve its FY35 and FY50 targets.
RDS targets a 20% reduction in net carbon intensity between FY16 and FY30, down to 63g CO2e/MJ. We forecast it will miss this target by ~3 percentage points, or 2.5g CO2e/MJ. The largest driver of net carbon intensity reductions are 120Mt of nature-based carbon offset (NbS), accounting for -4.5g CO2e/MJ, just over one-third of the total change. The carbon intensity also benefits from 11Mt of CCUS (-0.4g CO2e/MJ). The largest driver of the reduction in carbon intensity outside of its post-emission compensation is the increase in renewables (-1.9g CO2e/MJ), followed by the reduction in oil production (-1.4g CO2e/MJ), and increase in biofuels (-2.0g CO2e/MJ).
Chart: RDS FY30 carbon intensity change from FY19 (CO2e/MJ)
Chart: RDS FY30 absolute and net emission change from FY19
Source: Company data, Global Climate Insights estimates
From FY19, absolute emissions are forecast to increase by 204 Mt CO2e by FY30, 12% (1.1% p.a). Net emissions (post-emissions compensation) are forecast to increase 73 Mt CO2e, 4.4% (0.4% p.a). Absolute emissions growth is predominantly underpinned by continued expansion in natural gas and LNG production +276 Mt CO2e, exceeding the decline in oil -207 Mt CO2e.
No. Our assessments of whether corporate decarbonisation plans align with the Paris Agreement’s ambition to keep warming to 1.5°C are based on:
As we have detailed above, we forecast RDS will not be able to reduce net and absolute emissions between FY19 and FY30. In addition, the gap of its absolute emissions compared to the proportionate decrease illustrated by the IEA NZE and IPCC 1.5°C pathway is significant, at 48%.
Chart: Absolute emissions reduction FY19 to FY30/FY50, forecast for RDS (CO2e) vs Net Zero Scenario (NZS, CO2)
Source: Company data, Global Climate Insights estimates
Absolute emissions for RDS could greatly exceed that set out in the IEA NZE
By FY50 we forecast RDS absolute emissions to increase by 7%, compared to a 73% decline required in the NZS
RDS targets a 45% reduction in net carbon intensity to 43.3g CO2e/MJ by FY35. We forecast it will miss this target by ~24 percentage points, or 18.9g CO2e/MJ, delivering a 21% reduction in net carbon intensity. This includes an additional 14 Mt (-0.5g CO2e/MJ) of CCUS from FY30 and no additional carbon offsets. The largest driver of carbon intensity reduction between FY30-35 is the decline in oil (-0.8g CO2e/MJ), increase in power (-0.7g CO2e/MJ), and increase in renewables (-0.6g CO2e/MJ).
To achieve a 45% reduction in net carbon intensity, RDS will need to further reduce its net emissions by over 515 Mt CO2e/p.a by FY35.
Chart: RDS FY35 carbon intensity change from FY30 (g CO2e/MJ)
Chart: RDS FY35 net emissions change from FY30 (Mt CO2e)
Source: Company data, Global Climate Insights estimates
Increasing hydrogen production is a major component of RDS' energy transition strategy. Currently, RDS produces ~0.329 Mt of hydrogen p.a,8 of which <0.004% is based on renewable energy. If RDS were to reach its target of double-digit share of global clean hydrogen by FY30 (assume 10%),~40% of its hydrogen production would need to be renewably sourced to reduce its net carbon intensity. RDS will need to invest significantly in building renewable hydrogen capability to achieve its targets.
Table: RDS Hydrogen overview and assessment
| RDS target | 1. Produce 8x more low-carbon fuels by FY30 2. Double-digit share of global clean hydrogen by FY30 |
|---|---|
| What does it plan to make? | Gas-based hydrogen production with CCUS Hydrogen production using renewables |
| Current production | 329 kt p.a via Quest^13 gas-based hydrogen production, linked to an oil sands bitumen upgrader, with CCUS. 1.3 thousand tonnes p.a. renewable hydrogen at REFHYNE, Rheinland refinery^14. This equates to ~0.2% of current energy sold. |
| Energy production | FY30: 479,840 TJ, (62.5% gas / 37.5% renewable) FY50: 8,349,216 TJ, (39.3% gas / 60.7% renewable) |
| Use of CCUS/carbon offsets | FY30: 11 Mt p.a. CCUS FY50: 25 Mt p.a. CCUS (note this is RDS’ total target of CCUS) |
| Estimated carbon intensity | Gas-hydrogen (100g CO2e/MJ used in our forecast) Renewable hydrogen (0g CO2e/MJ assumed in our forecasts) |
| End use | Focus for RDS: Heating, heavy transport, industry. Sectors without other lower-emission alternatives: Chemicals, Steel (feedstock/heat). |
| Risks to decarbonisation | We have used a carbon intensity of gas-based hydrogen production of 100g CO2e/MJ. This exceeds RDS’ current oil intensity of 89g CO2e/MJ. There is a risk this may be higher once factoring in fugitive methane emission. Use of CCUS may address half of the carbon intensity but will also increase emissions from the total energy required.[13] |
| Risks to RDS strategy | RDS has only limited hydrogen production using renewables, which will be essential to reduce its GHG emissions. |
RDS plans to produce 8x more low-carbon fuels (biofuels and hydrogen) by FY30. Given its hydrogen market share targets, we forecast biofuels sales will increase from ~9.5 bn litres in FY20 to ~79 bn litres by FY30. The majority of RDS’ biofuel production comes from its Raizen joint venture. There are two types of biofuels - ethanol and biodiesel - of which RDS today produces mostly ethanol.
The estimates of carbon intensity of biofuels vary greatly depending on the type of agriculture feedstock and how lifecycle emissions are defined. For some combinations, the carbon intensity may not be significantly lower than oil. In addition, there are large land use implications, where biofuels may indirectly drive the expansion of agriculture into areas of high carbon stock such as rainforest or peatlands,[14] and be in competition for food production.
The two primary uses of biofuels are for transportation (including long-haul) and aviation. However, transportation has alternatives, such as electrification for vehicles and ammonia for shipping. Furthermore, trucks may benefit from electrification and replacement of transport modes (trains). Aviation does not have strong alternatives that are low-carbon; however there are practical barriers, including the amount of feedstock needed, where the volume required for a large jet using 100% biofuel would be the equivalent of 40,000 square metres of palm oil.[15]
We estimate the use of biofuels will decrease RDS’ FY30 net carbon intensity by 1.4 gCO2e/MJ.
Table: RDS Biofuels overview and assessment
| RDS target | RDS' ambition is to produce 8x more low-carbon fuels (biofuels and hydrogen) by FY30. |
|---|---|
| What does it plan to make? | RDS has not specified fuel mix; however, it has disclosed a focus on the following fuels[16]: Renewable diesel (from used cooking oil, waste animal fat and other industrial and agricultural residual products, and vegetable oils such as rapeseed)[17] Sustainable aviation fuel (SAF) Bioethanol, ethanol produced through fermentation of carbohydrate or sugar crops (corn, wheat, sugar cane). Renewable compressed natural gas, made from organic waste |
| Current production | In FY20 RDS sold 9.5 bn litres of biofuels (<1% of total energy sold). This is largely from its 50% Raízen joint venture in Brazil, which produced 2.5 bn litres of ethanol and 4.4 m tonnes of sugar cane. |
| Energy production (FY30 and FY50 forecast) | FY30: 1,524,160 TJ FY50: 2,167,052 TJ |
| Use of CCUS/carbon offsets | None required. |
| Estimated carbon intensity | We assume 38g CO2e/MJ, in line with RDS carbon intensity. We note this excludes GHG emissions from combustion. Biofuel carbon intensity can range from 16-135.7g CO2e/MJ depending on the fuel type and feedstock.[18] |
| Impact on carbon intensity - FY30 | We estimate a decrease in net carbon intensity of 1.4g CO2e/MJ by FY30. |
| Impact on carbon intensity - FY50 | We estimate a decrease in net carbon intensity of 0.7g CO2e/MJ by FY50. |
| End use | Focus for RDS: Ethanol can be blended for transportation fuel. Biodiesel is a potential alternative to jet fuel (Sustainable Aviation Fuel). As at FY20, this is 3% of the biofuel market.[19] Sectors without other lower-emission alternatives: Aviation fuel, but there are barriers to biofuel’s decarbonisation potential and its ability to fully decarbonise air transport. |
| Risks to decarbonisation | Ethanol and biodiesel are not carbon neutral. They generate emissions from crop cultivation, feedstock processing, transportation, and combustion. RDS’ carbon intensity of biofuel is 38g CO2e/MJ, which excludes emissions from end use. There are significant land use implications depending on the agricultural feedstock. |
| Risks to RDS strategy | This market is in its early stages of development. RDS needs to determine which biofuel they plan to sell and ensure they have capacity and capability to deliver. |
Source: Company data, Global Climate Insights estimates
Renewable power is an essential cornerstone of a decarbonised world, accounting for 88% of electricity in the IEA’s NZE by FY50.[20] RDS' renewable power ambitions are: 1) doubling electricity sold by FY30, and 2) delivering renewable power to the equivalent of 50 million households by FY30. RDS' targets imply RDS will deliver 3.8 TJ of power per year by FY30 (2.2 TJ FY20, 70% increase), of which ~24% is renewable[21]. We forecast this renewable target will contribute to a ~2.5% decrease in the company’s net carbon intensity.
Table: RDS renewables overview and assessment
| RDS target | Double electricity sold by FY30. Deliver >50 m households’ equivalent renewable power by FY30. |
|---|---|
| What does it plan to make? | We believe RDS will rely on its own solar and wind generation and that purchased from third-parties. |
| Current energy delivered | 8,623 million MJ p.a |
| Energy forecasts | FY30: 3,789,000 million MJ, (60% fossil / 40% renewable) FY50: 7,524,843 million MJ, (23% fossil / 77% renewable) |
| Use of CCUS/offsets | None required. |
| Estimated carbon intensity | Fossil-based power 57g CO2e/MJ Renewable power assumes 0g CO2e/MJ |
| Forecast impact on carbon intensity | FY30: A decrease in net carbon intensity of 2g CO2e/MJ. FY50: A decrease in net carbon intensity of 6g CO2e/MJ |
| Risks to RDS strategy | RDS has limited expertise in the renewable energy sector. Currently, its own renewable power comprises ~0.4% of its total power delivered. RDS will be relying heavily on third-party contracts, grid renewables, and acquisitions (e.g FY19 ~A$617m acquisition of Australian energy retailer ERM) to achieve its ambitions. |
Source: Company data, Global Climate Insights estimates
RDS lacks a strong presence and expertise in the renewable energy sector. RDS has a renewable capacity of 8,623 million MJ p.a operational today (see appendix), ~0.4% of its total power sales. RDS' current and future renewable investments amount to a capacity of 62,387 million MJ per year. This accounts for ~4% of RDS' 2030 renewables target, and the remaining 96% must come from additional investment in renewable projects, acquisitions, and purchased renewable power from third-party producers over the coming decade.
RDS' primary decarbonisation strategies depend heavily on post-emission compensation technologies such as carbon capture utilisation and storage (CCS and CCUS) and carbon offsets. In this section we review what role these technologies can play and their effectiveness. We do not review carbon credits that may be generated from these technologies which have separate issues that must be considered when assessing the credibility of a decarbonisation strategy.
In our view, both CCUS and carbon offsets require significant capital in order to compensate for the emissions generated by fossil fuels. Both have limitations in their ability to ‘neutralise’ emissions in their implementation, and should be viewed as a transition (temporary) tool for hard-to-abate sectors. In the next ten years, strategic capital allocation in pursuit of building a business model that can thrive in a zero emissions economy will be crucial for RDS’ long-term value. Capital expenditure in pursuit of “carbon compensation” should be scrutinised in comparison to proven technologies that reduce emissions today.
Carbon Capture and Storage (CCS) is the process of capturing CO2 from industrial production or the atmosphere for permanent storage, most commonly in underground reservoirs. Carbon Capture Utilisation and Storage (CCUS) involves using that carbon in further processes (including enhanced oil recovery). This does not lead to the same reduction of CO2 in the atmosphere and can enable further CO2 emissions through ongoing fossil-fuel production. For the purpose of analysis we use the term CCUS to cover both carbon storage and carbon utilisation, as it is often unclear how much CO2 is permanently stored.
CCUS has the potential to capture emissions at large point sources, including gas production, synthetic fuel plants, fossil-fuel hydrogen plants, power plants, major CO2 emitting industries (cement and steel), refineries (chemicals and oil) and for biofuels.
CCUS cannot be used to capture all CO2 emissions. For RDS, it can only address Scope 1 emissions, which is 4-5% of its total emissions inventory. RDS customers might implement CCUS for energy intensive processes as mentioned above; however it is unlikely that all CO2 emissions will be addressed across RDS’ value chain. CO2 from distributed fossil fuel combustion (transport) and other GHG emissions, including methane, cannot be addressed with CCUS.
Quest Canada is RDS’s first CCUS project (owned 10% by RDS, 70% Canadian Natural Resources Limited, and 20% Chevron). The plant which uses CCUS produces hydrogen that is used to mix with bitumen to create synthetic oil products. The CO2 is stored geologically; however the hydrogen produced is not reducing emissions but rather enabling further production of synthetic crude oil. The average capture ratio of CO2 at Quest in FY19 was 78.8%[22]. CCUS solutions used to generate lower-carbon fuels that can be used as a substitute for traditional fossil fuels for hard-to-abate sectors (cement, steel, chemicals) should be prioritised over expanding crude oil production.
The diagram below shows an example of CCUS use, under both geological storage (Gorgon Project) and for utilisation (Quest Canada). The diagram below shows an example of CCUS use, under both geological storage (Gorgon Project) and for utilisation (Quest Canada).
Diagram: Overview of Carbon Capture Storage and Utilisation (CCUS)
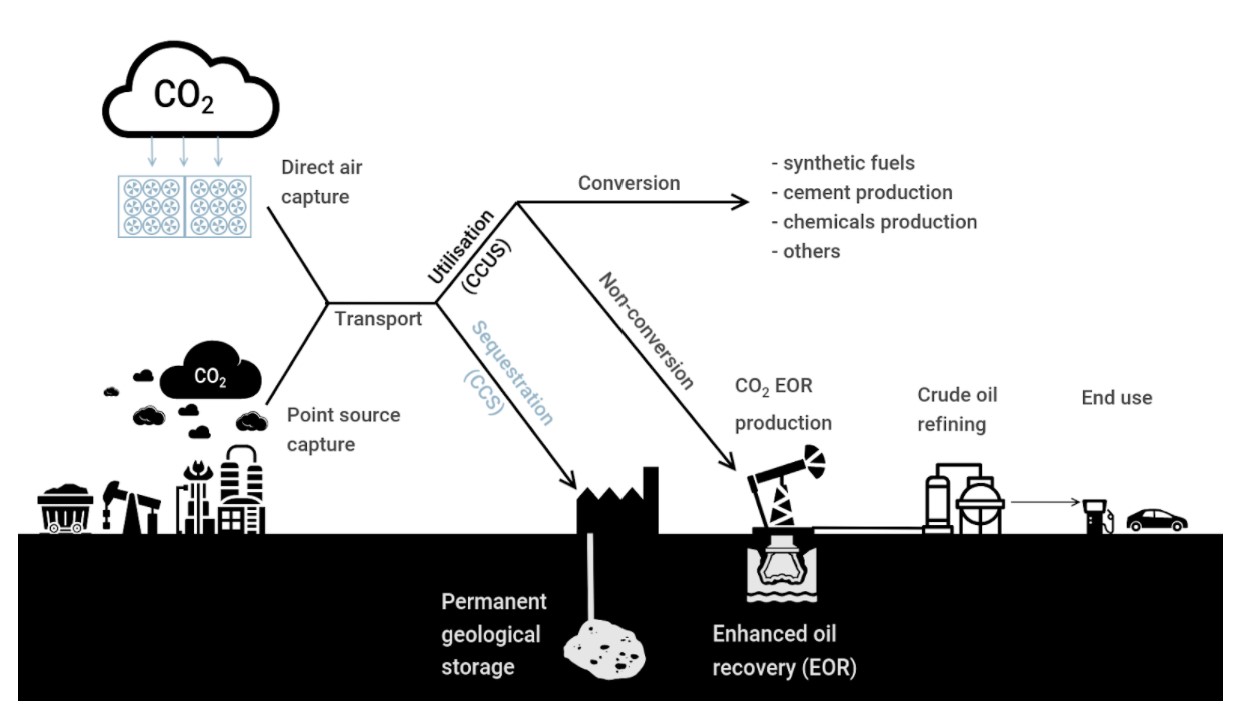
Source: Global Climate Insight illustration [23]
Table: RDS CCUS overview and assessment
| RDS target | 25 Mt p.a. of CCUS by FY35 |
|---|---|
| Where does RDS plan to use CCUS? | RDS has not identified the specific plants and processes (pre-combustion - CO2 captured before the fuel is burnt, or post- combustion - CO2 captured after the fuel is burnt, predominantly through flue gas streams) where CCUS will be used. CCUS has been referred to in RDS’ discussion of its strategy for hydrogen production, natural gas processing, and power generation. |
| Current capture | 1.2 mt pa of CO2, implying a 21x increase by FY35. We do not have details on contributions by project but believe this includes Quest Canada and Gorgon. |
| Forecast impact on carbon intensity | Our forecast assumes CCUS peaks at 25Mt in FY35. As RDS does not have targets beyond FY35 we have not increased use of CCUS. This also allows us to see a clearer trend of absolute GHG emissions. Impact on forecast carbon intensity: FY30: decrease of ~0.4g CO2e/MJ (~0.4% of RDS FY19-FY30 carbon intensity reduction) FY50: decrease of ~0.4g CO2e/MJ(~0.6% of RDS FY31-FY50 carbon intensity reduction) If the 25 Mt of CO2 is not permanently stored, forecasted emission intensity will increase. |
| Risks to decarbonisation | Capture rate. Not all CO2 can be captured, with peak capture rates estimated to reach 85-95% [24]. The higher the capture rate, the more expensive the CCUS technology. In CCUS used for Enhance Oil Recovery (EOR), capture rate tends to be lower than the peak rate, as plants are not designed to capture the highest share of CO2, but to create a cheap source of CO2. Permanence of stored CO2. Storage sites will need to be monitored for leaks. The amount of CO2 stored may be significantly less if leaks are not accurately detected or addressed in a timely manner. In CCUS for enhanced oil recovery, it will likely lead to more lifetime emissions, rather than emissions reduction.[25] Ongoing monitoring and liabilities. Companies will need to monitor and maintain sites over long durations of 100+ years. Additionally, companies will need provisions for costs to maintain sites, and account for reversal of CCUS benefits that do not eventuate. Misalignment of incentives and timeframe. CO2 must be stored forever. In contrast, the entities responsible for meeting this obligation may last 50-100 years, and executive tenures of 3-10 years. There is a mismatch between the short-term incentive to produce and use CCUS vs the long-term environmental imperative to manage the CO2. Consequently, the cost is likely to be borne by future generations and governments. Energy intensity. CCUS requires a significant amount of energy, ranging from 0.25-0.3 MWh/tonne of CO2 captured.[26] Energy is often provided by fossil fuels, increasing the CO2e and Scope 2 emissions.[27] As an example, this equates to 355 million MJ p.a for Quest to capture and store CO2. CCUS use in sectors with available low-carbon alternatives. RDS' current investments are largely positioned towards sectors that have readily available renewable alternatives (electricity generation and heating). Pursuing CCUS for these uses will be financially costly, and will prevent reduction in absolute emissions. |
| Risks to RDS strategy | High uncertainty of achieving intended outcome. Targets hinge on unproven advances in CCUS technology. This includes achieving a carbon capture efficiency of up to 95%. Impairment risk. Uncertainty in technologies creates risk of write-downs. Costly. There are associated capital expenditures and operating costs per tonne of CO2 captured. For example, the total project cost for Quest was US$1.35 billion, and the plant carries operating costs of up to US$63 per tonne CO2 captured. Costs are likely to vary considerably and increase quickly (Chevron/RDS Gorgon Project CCS has cost ~US$2.5bn[28] to date and stored ~5 Mt CO2, equivalent to $480m per tonne). This is in addition to the ongoing cost of monitoring and potential liabilities. The costs will also be influenced by the parts of the process where CCUS is applied (pre or post combustion), and where the CO2 is stored (existing reserves/geological formation onshore or offshore). |
Source: Company data, Global Climate Insights estimates
To achieve net-zero by 2050, RDS will utilise carbon credits to offset its emissions. A carbon credit represents the avoidance or removal of one tonne of CO2 in compensation for the emissions generated.[29]
To date, RDS has set targets for Nature Based Solutions (NbS) carbon offsets only. NbS are methods that enhance the natural carbon sinks by either preventing, reducing, or removing CO2 from the atmosphere. We believe that RDS will be highly reliant on carbon offsets to compensate for the absolute emissions that it will continue to produce, with an annual requirement of ~1,6 Gt CO2 by FY50. This includes up to 271 Mt CO2 p.a to compensate for gas production targets, 300 Mt CO2 p.a for its LNG production targets, and up to 328 Mt CO2 p.a to offset hydrogen targets.
The voluntary carbon offset market is highly speculative and volatile, and the ability of underlying projects to demonstrate real and permanent emissions reduction differs widely. Importantly, at a climate response level, one carbon offset does not balance one carbon emitted.[30] The projects underlying the carbon credits can only compensate for CO2 emissions, leaving RDS’ methane and other greenhouse gas emissions unanswered.
Table: RDS carbon offsets overview and assessment
| RDS target | 120mt p.a of Nature-based carbon offsets by FY30. |
|---|---|
| Where does it plan to use offsets? | “Carbon neutral” LNG and to offset residual absolute emissions |
| Current production | In FY20, RDS retired 4.3 Mt CO2e worth of carbon credits generated from avoided forestation, of which 3.9 Mt CO2e was included in its net carbon intensity. This is likely to have been used for sale of its “carbon neutral” LNG. RDS’ current projects focused on planting of new trees (afforestation) are in the early stages and do not produce carbon credits. The combined peak sequestration of current projects equates to 0.16Mt of CO2 annually (<0.15% of its target). In FY20 it purchased Select Carbon (Australia), which has a portfolio of 70 carbon farming projects that span an area of more than 9m hectares. By FY30, RDS aims to acquire most of its carbon credits via its own portfolio, with the remainder purchased through the voluntary carbon market. |
| Forecast impact on carbon intensity | Impact on forecast carbon intensity: FY30: RDS’ offset target will decrease net carbon intensity by 4.6g CO2e/MJ (~ 6% of RDS FY19-FY30 carbon intensity reduction) FY50: RDS’ offset target will have no effect on net carbon intensity between FY31-50. |
| Risks to decarbonisation | Volume required. RDS’ FY30 target equates to 240,000 square kilometres of land[31], approximately the size of the UK. Quality. Offsets programs need to show that they result in additional emissions reduction, that emissions will be permanently stored, and avoid any double counting. In considering which carbon offsets are more likely to drive reduction in CO2, we have a clear preference for creating new projects to store carbon over avoided emissions, given how difficult the benefits are to measure and verify. Overestimation risk. A 2016 study on the effectiveness of the EU Emissions Trading Scheme found 73% of potential certificates issued were likely to have overestimated emission reduction.[32] Lead time. Newly planted saplings take decades to mature[33] and reach peak carbon sequestration capacity[28:1]. Permanence. For nature-based carbon offsets, threats of wildfires, drought, and disease create risk to permanence. Ensuring CO2 stored is reflective of offset value, which will require a costly, complex, long-term monitoring program. Risk to biodiversity. Nature-based solutions involving afforestation must be carefully managed to prevent overplanting of monoculture species for their absorption or fast growth over consideration on how it impacts local biodiversity.[34] |
| Risks to RDS’ strategy | Whilst trees are valuable carbon sinks, their value as a tradable credit to negate future emissions is highly speculative, and creates risk to achieving real emissions reduction. |
Source: Company data, Global Climate Insights estimate
Initiation of coverage, Part 1: Royal Dutch Shell GHG emissions | October 2021
Please read the terms and conditions attached to the use of this site.
RDS (2016) Q42016 Quarterly Results announcement. ↩︎
NASA (2019) The Atmosphere: Getting a Handle on Carbon Dioxide. ↩︎
The historical cumulative CO2e carbon budget is calculated by Global Climate Insights using the 1750-2019 historical greenhouse emission data (Nicholls, Z.R.J, et al., 2020, https://doi.org/10.5194/gmd-13-5175-2020) and 100-year Global Warming Potentials for greenhouse gases. See explanatory note under section 4.3 Definitions; Historical Cumulative carbon budget (CO2e)) ↩︎
The remaining CO2e carbon budget to stay below 1.5C global warming with a 83% likelihood is calculated using the relationship between cumulative CO2 emissions and cumulative greenhouse gases based on the scenarios from IPCC (2018): Global Warming of 1.5°C, https://www.ipcc.ch/sr15/. See explanatory note under section 4.3 Definitions; Remaining carbon budget (CO2e)). ↩︎
Based on the RDS estimate using IPCC’s fifth assessment of global warming potential. ↩︎
Brandt, A. R., et al. (2014) https://doi.org/10.1126/science.1247045; Peischl, J., et al (2016) https://doi.org/10.1002/2014JD022697; Hausmann, P. et al (2016) https://doi.org/10.5194/acp-16-3227-2016; ↩︎
Henne, et al. (2016) https://doi.org/10.5194/acp-16-3683-2016 ; Luhar, et al. (2020) https://doi.org/10.5194/acp-20-15487-2020. ↩︎
Reuters (2021) US, EU pursuing global deal to slash planet-warming methane. ↩︎
US EPA (2020) Understanding Global Warming Potentials. ↩︎
RDS (2021) Energy Transition Strategy. ↩︎
Blank et al (2020) Hydrogen’s Decarbonization Impact for Industry. ↩︎
IEA (2021) Net zero by 2050: A roadmap for the global energy sector. ↩︎
IEA (2019) Future of hydrogen.\ ↩︎
Centre for International Forestry Research (2011) A global analysis of deforestation due to biofuel development. ↩︎
Chris Goddall (2020) What we need to do now: for a zero carbon future. ↩︎
Royal Dutch Shell, Low carbon fuels ↩︎
Royal Dutch Shell (2021), Shell to build one of europe's biggest biofuels facilities ↩︎
Global Climate Insight range, based on papers cited in footnote 18 and 19 below. ↩︎
BNEF (2021) Global Renewable Fuel Projects Tracker. ↩︎
IEA (2021) Net zero by 2050: A roadmap for the global energy sector. ↩︎
1 household consumes ~5000 kwh/year. AER (2020) Residential energy consumption benchmarks ↩︎
Quest Carbon Capture and Storage (CCS) Project (2020), FY19 Quest CO2 capture ratio performance ↩︎
Sekera, J., Lichtenberger (2020) https://doi.org/10.1007/s41247-020-00080-5. ↩︎
E3G (2021) Hydrogen: factsheet series. ↩︎
Núñez-Lópezm, V. et al (2019) https://doi.org/10.3389/fclim.2019.00005. ↩︎
Climate policy watcher (2021) Efficiency parameters of CCS. ↩︎
Robert Howart & Mark Jacobson (2021) How green is blue hydrogen? ↩︎
Royal Dutch Shell Working with Customers to Compensate for Their Emissions ↩︎
Zickfeld, K. et al (2021) doi:10.1038/s41558-021-01061-2. ↩︎
Carbon Independent (2019) Planting trees is not the answer ↩︎
Stockholm Environment Institute (2016) How additional is the Clean Development Mechanism. ↩︎
Woodland Trust (2019) Life cycle of a tree: how trees grow ↩︎
Seddon et al (2020) Understanding the value and limits of nature-based solutions to climate change and other global challenges. ↩︎
Get email updates about new ACCR research and shareholder advocacy on specific topics of interest to you.
Sign Up