20th April 2022
Publication Information
Download Publication
- 821 KB PDF
- 20th April 2022
Stay Informed
Get email updates about new ACCR research and shareholder advocacy on specific topics of interest to you.
Sign UpGlencore Plc
(ISIN:JE00B4T3BW64, SEDOL:B4T3BW6)
AGM date and location: 12.00pm CEST, 28 April 2022, Zug, Switzerland
Contacts:
Dan Gocher, Director of Climate and Environment
Naomi Hogan, Strategic Projects Lead
Glencore is likely understating its operational emissions by at least 11-24% on an annual basis, due to underreporting of methane emissions from its Australian coal mines. While Glencore has claimed that it is compliant with Australian regulatory standards, satellite data suggests its methane emissions are grossly understated. This highlights a need for improved disclosure and transparency from Glencore and for greater regulatory oversight of methane emissions reporting.
Underreporting of methane emissions is a major problem globally. Australia’s reported methane emissions from coal mining are approximately half what the International Energy Agency estimates.
Recent peer-reviewed research based on satellite observations identified Glencore’s Hail Creek and Oaky North coal mines as “super-emitters”. Hail Creek was estimated to emit 20% of Australia’s methane emissions from coal mining, while accounting for just 1% of national coal production.
These excessive methane emissions are not reflected in Glencore’s emissions inventory. Glencore’s 2019 emissions baseline, upon which its 2026, 2035 and 2050 emissions reduction targets are based, is likely inaccurate, and is likely to be at least 24% higher than what has been disclosed.
In response to the findings, Glencore has attempted to discredit satellite observations and claimed that its disclosures are compliant with Australian regulatory standards.
Addressing methane emissions is imperative to tackling climate change. With this information, investors should:
Demand Glencore explain its use of premining degasification and the methods it has used to measure methane emissions at all coal mines since 2018, and a plan for enhancing its reporting of methane emissions, with reference to satellite data where appropriate;
Use their industry associations such as the Institutional Investors Group on Climate Change (IIGCC) and the Investors Group on Climate Change (IGCC) to advocate for improved measurement, mitigation and reporting of methane emissions from coal mining and the broader energy sector;
At the upcoming Annual General Meeting on 28 April 2022:
In July 2021, energy analytics firm Kayrros used satellite data to estimate that the coal mining sector in Queensland’s Bowen Basin emitted an average of 1.6 million tonnes of methane per year in 2019 and 2020.[1] According to Australian government figures for the same period, only a third of that amount of methane was reported in the area.[2] Kayrros further observed that the intensity of the top quartile of mines is five times higher than for the bottom quartile.[3]
In November 2021, scientists from the SRON Netherlands Institute for Space Research (Sadavarte et al, 2021) used satellite data to estimate methane emissions from a cluster of six coal mines in Queensland’s Bowen Basin.[4] The six surface and underground coal mines, described as “super-emitters”, were estimated to have emitted 570,000 tonnes of methane per year in 2018 and 2019 (see Table 1).[5]
Table 1. Estimated methane emissions from super-emitting mines in Queensland (2018-19)[6]
| Source | Coal mine | Operator | Mine type | Coal type | CH4 tonnes p.a. |
|---|---|---|---|---|---|
| Source 1 | Hail Creek | Glencore | Surface | Metallurgical/thermal | 230,000 (± 50,000) |
| Source 2 | Broadmeadow | BHP-Mitsubishi | Underground | Metallurgical | 190,000 (± 60,000) |
| Moranbah North | Anglo American | Underground | Metallurgical | ||
| Grosvenor | Anglo American | Underground | Metallurgical | ||
| Source 3 | Oaky North | Glencore | Underground | Metallurgical | 150,000 (± 63,000) |
| Grasstree | Anglo American | Underground | Metallurgical | ||
| Total | 570,000 |
Source: Sadavarte et al (2021)
The Hail Creek mine—majority owned and operated by Glencore since August 2018—was the worst of the six, emitting 230,000 tonnes of methane in 2018 and 2019.[7] Hail Creek was estimated to emit 20% of Australia’s methane emissions from coal mining over the period studied, while accounting for just 1% of national coal production.[8]
A Glencore spokesperson attempted to dismiss the findings by claiming that “it is not credible that a single open cut coal operation is responsible for 20 per cent of the industry's total annual methane emissions.”[9]
Sadavarte et al (2021) suggested there was “a large underreporting of methane emissions in the national inventory reporting for surface mines”, due to the discrepancy between bottom-up reporting and satellite observations.[10]
Sadavarte et al (2021) also suggested the excessive methane emissions at Hail Creek may have been caused by “premining degasification” prior to underground mining as a safety measure against outbursts of methane.[11] Flaring activities (burning of excess methane) were observed in July-September 2019, but not throughout the remainder of 2018 and 2019.[12] Only Glencore (and Rio Tinto who was the operator until August 2018) can provide further clarity about whether these excessive methane emissions were the result of intentional degasification.
In February 2022, the SRON Netherlands Institute for Space Research further estimated that Hail Creek emitted between 133,000 to 223,000 tonnes of methane in 2020 and between 123,000 and 263,000 tonnes of methane in 2021.[13] Estimates of methane emissions from the two Glencore mines studied are collated below, alongside the emissions reported at each facility to Australia’s Clean Energy Regulator.
Estimates of methane emissions from Hail Creek were between 10-13 times greater than what was reported to regulators (noting that facility reported emissions include diesel use, flaring etc). Methane emissions from Oaky North were nearly double what was reported to regulators.
Table 2. Estimated methane and reported emissions from Hail Creek and Oaky North mines, 2018-21
| 2018 | 2019 | 2020 | 2021 | |
|---|---|---|---|---|
| Hail Creek, estimated CH4 emissions (midpoint of range) | 230,000 | 230,000 | 178,000 | 193,000 |
| Hail Creek, estimated CH4 emissions (MtCO2e) | 6.44 | 6.44 | 4.98 | 5.40 |
| Hail Creek safeguard facility reported emissions (MtCO2e) | 0.55 | 0.50 | 0.50 | 0.54 |
| Oaky North, estimated CH4 emissions (midpoint of range)[14] | 75,000 | 75,000 | NA | NA |
| Oaky North, estimated CH4 emissions (MtCO2e) | 2.10 | 2.10 | NA | NA |
| Oaky North safeguard facility reported emissions (MtCO2e) | 1.05 | 1.14 | 1.23 | 0.78 |
Source: Sadavarte et al (2021), Clean Energy Regulator
Methane is a powerful, heat-trapping greenhouse gas (GHG), and the second biggest contributor to human-induced global warming after carbon dioxide. Methane has a far higher global warming potential (GWP) than carbon dioxide, particularly in the short-term.[15]
In 2021, for the second year in a row, the National Oceanic and Atmospheric Administration (NOAA) observed a record annual increase in atmospheric levels of methane.[16] According to the Intergovernmental Panel on Climate Change (IPCC), today’s concentrations of methane in the atmosphere are higher than at any time in at least 800,000 years.[17]
Underreporting of methane emissions from the energy sector is a global problem. According to the International Energy Agency (IEA), “methane emissions from the energy sector are about 70% greater than the sum of estimates submitted by national governments.”[18] Australia’s reported methane emissions from coal mining are approximately half what the IEA estimates (see Table 3).
Table 3. Australian methane emissions from energy sources, UNFCCC and IEA estimates (kt)[19]
| UNFCCC 2021 | IEA estimate | |
|---|---|---|
| Oil and natural gas - upstream | 230 | 492 |
| Oil and natural gas - downstream | 112 | 81 |
| Coal | 900 | 1,754 |
| Bioenergy | - | 18 |
| Total | 1,242 | 2,345 |
Source: International Energy Agency (IEA)
Australia’s National Greenhouse and Energy Reporting (Measurement) Determination (2008)[20] outlines the methods by which operators should measure methane emissions from underground and open cut coal mines.
If, as Sadavarte et al (2021) suggested, the excessive methane emissions at Hail Creek were caused by “premining degasification”, then Glencore would be required to use Method 4—Direct measurement of emissions. In practice, Method 4 implies that “vented emissions must be measured directly using measurement equipment at the emissions source, being vented via coal mine return ventilation or surface gas drainage where occurring”.[21]
If the emissions occurred during the extraction of coal, then Glencore would be required to use Method 1—State-based emission factor for methane or Methods 2 or 3—Mine specific in-situ gas modelling. It is not clear which method Glencore used to quantify emissions at Hail Creek and Oaky North.
State-based emission factors vary significantly between states. The emission factors used for open-cut or surface mines in NSW is more than 2.5 times greater than that used for Queensland surface mines.[22]
Table 4. Emission factors for the production of coal (fugitive) – Open cut
| Activities related to extraction of coal (fugitive) | Emission factor (tonnes CO2-e/ tonne raw coal) (CH4) |
|---|---|
| Open cut mines—NSW | 0.061 |
| Open cut mines—Queensland | 0.023 |
| Open cut mines—Tasmania | 0.019 |
| Open cut mines—Victoria | 0.0003 |
| Open cut mines—South Australia | 0.0003 |
| Open cut mines—Western Australia | 0.023 |
Source: Clean Energy Regulator
Despite being one of the world’s largest exporters of coal and gas, Australia has resisted global efforts to tackle methane emissions. At COP26, over 100 countries signed a pledge to reduce methane levels by 30% by 2030.[23] Australia refused to join the initiative.
Glencore publishes aggregate emissions in its Climate Change and Sustainability reports, and more granular emissions data in its annual ESG Data Book.[24] Glencore is not expected to publish its 2021 ESG Data Book until May 2022.
Glencore’s total carbon footprint is highly correlated with coal production. The use of sold products (Scope 3, Category 11), mostly made up of coal and some oil, contributes more than 90% of Glencore’s total carbon footprint.[25]
Table 5: Glencore’s GHG emissions performance, 2016-2021
| MtCO2e | 2016 | 2017 | 2018 | 2019 | 2020 | 2021 |
|---|---|---|---|---|---|---|
| Scope 1 | 23.1 | 21.8 | 18.8 | 18.3 | 15 | 15 |
| Scope 2 | 11.9 | 11.5 | 11.8 | 11 | 9.3 | 10.8 |
| Scope 3 | 302 | 290 | 313 | 343 | 271 | 254 |
| Coal production | 124.9 | 120.6 | 129.4 | 139.5 | 106.2 | 103.3 |
Source: Glencore plc
According to Glencore’s emissions inventory, fugitive methane emissions contribute approximately 14% of its operational emissions (Scope 1+2), or 4.1 MtCO2e in 2019 and 3.6 MtCO2e in 2020 (see Chart 1).
Chart 1. Glencore’s Scope 1+2 2019 emissions baseline by source
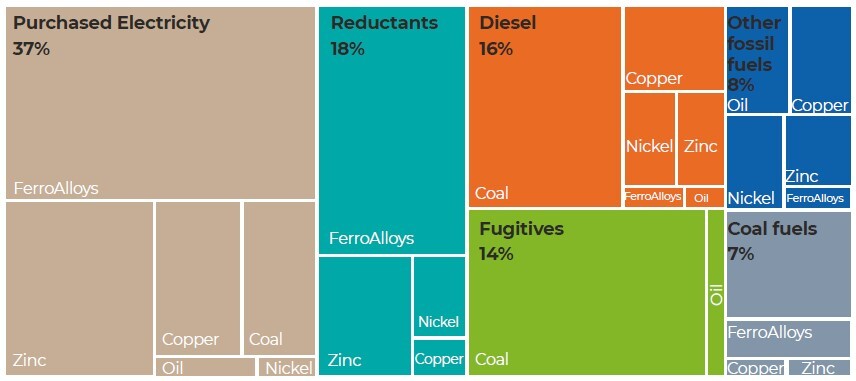
Source: Glencore plc
Impact of additional methane emissions on Glencore’s inventory
In order to measure the impact of additional methane emissions at Hail Creek and Oaky North on Glencore’s emissions inventory, we took the following steps:
Table 6. Glencore’s operational emissions, adjusted for additional methane emissions (MtCO2e)
| 2018 | 2019 | 2020 | 2021 [28] | |||
|---|---|---|---|---|---|---|
| Direct emissions by source (Scope 1) | Fossil fuels | Solid fossil fuels | 1.9 | 2.3 | 1.9 | 1.9 |
| Liquid fossil fuels | 5.7 | 5.3 | 4.3 | 4.3 | ||
| Gaseous fossil fuels | 0.7 | 1.1 | 0.7 | 0.7 | ||
| Reductants | 5.6 | 5.2 | 4.1 | 4.1 | ||
| Emissions from fossil fuel extraction | Underground | 3.0 | 2.2 | 1.7 | 1.7 | |
| Open pit and stockpiling | 1.2 | 1.5 | 1.3 | 1.3 | ||
| Decommissioned mines | 0.3 | 0.4 | 0.6 | 0.6 | ||
| Other direct GHG emissions | 0.4 | 0.4 | 0.4 | 0.4 | ||
| Indirect emissions (Scope 2) | 11.7 | 11.0 | 9.3 | 10.8 | ||
| Total | 30.5 | 29.3 | 24.3 | 25.8 | ||
| Hail Creek additional methane | 2.7 | 6.4 | 5.0 | 5.4 | ||
| less Hail Creek reported emissions | -0.2 | -0.5 | -0.5 | -0.5 | ||
| Oaky North additional methane | 2.1 | 2.1 | NA | NA | ||
| less Oaky North reported emissions | -1.1 | -1.1 | NA | NA | ||
| Total including additional methane | 34.0 | 36.2 | 28.5 | 30.7 | ||
| Percentage increase | 11% | 24% | 18% | 19% |
Source: Glencore plc, Sadavarte et al (2021), Clean Energy Regulator
Given the midpoint of the estimated range of additional methane emissions and the deduction of all facility-level emissions (rather than just fugitives), we conservatively estimate that Glencore underreported its operational emissions by 11-24% between 2018 and 2021.
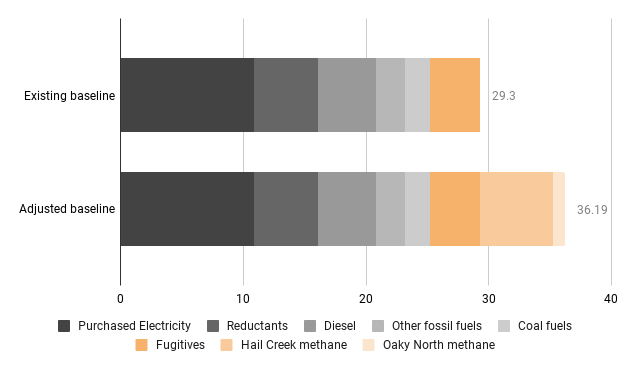
Glencore’s 2019 emissions are significant, because it is the baseline year for its 2026, 2035 and 2050 emissions reduction targets. If the satellite observations are correct, then Glencore’s 2019 emissions baseline is understated by at least 6.9 million tonnes CO2e, or 24% (see Chart 2).
Chart 2. Glencore’s Scope 1+2 2019 emissions baseline, existing and adjusted (MtCO2e)
In November 2021, Glencore attempted to dispute the findings from Sadavarte et al (2021), claiming that the magnitude of estimated methane emissions from Hail Creek was “not credible” and that the methane emissions from its Bowen Basin operations were already “accounted for in Glencore’s robust climate change targets”.[29]
In February 2022, Glencore further disputed the accuracy of satellite data to measure methane emissions:
“...questions have been raised about the ability of satellite imagery to correctly or accurately identify, quantify, isolate or attribute different emission sources, particularly in an area with numerous mining operations and without ground based or low level aerial monitoring.”[30]
Glencore spokesperson, February 2022
Glencore does not disclose to shareholders how it measures methane emissions from its coal mining operations. Nor has it disclosed to shareholders how it intends to reduce its methane emissions in order to meet its emissions reduction targets. Glencore’s criticism of peer-reviewed scientific research appears to be an attempt to deflect from its poor management and/or intentional venting of, and subsequent underreporting of methane emissions.
Glencore must explain to its shareholders why its existing emissions inventory should be trusted. Compliance with regulators is a minimum expectation, and where emissions are demonstrably greater than what is reported, operators must be expected to take steps to improve transparency.
Glencore must also explain whether the excessive methane emissions observed at its Bowen Basin operations were the result of intentional premining degasification. If it was intentional, and Glencore failed to accurately measure and report these emissions, it suggests there is a serious governance issue within the company.
It is worth noting that Glencore has previously funded campaigns to dispute climate science,[31] so its criticism of scientific research on methane emissions should rightfully be discounted.
Shareholders should take action by demanding immediate answers from Glencore. At its annual general meeting on 28 April, shareholders should also:
In the longer term, institutional investors must use their industry associations—including the Institutional Investors Group on Climate Change (IIGCC) in Europe and the Investor Group on Climate Change (IGCC) in Australia—to lobby for improved measurement, mitigation and reporting of methane emissions from coal mining and the broader energy sector.
Please read the terms and conditions attached to the use of this site.
Australasian Centre for Corporate Responsibility
Kayrros (2021), ‘New data show cutting methane emissions from Australia’s coal mines by half would be a big climate win’, link ↩︎
Steve Cannane, ‘How satellites are challenging Australia's official greenhouse gas emission figures’, ABC News, 3 Dec 2021, link ↩︎
ibid. ↩︎
Sadavarte et al (2021), ‘Methane Emissions from Superemitting Coal Mines in Australia Quantified Using TROPOMI Satellite Observations’, Environmental Science & Technology, link ↩︎
ibid. ↩︎
ibid. ↩︎
ibid. ↩︎
ibid. ↩︎
Steve Cannane, ‘How satellites are challenging Australia's official greenhouse gas emission figures’, ABC News, 3 Dec 2021, link ↩︎
Sadavarte et al (2021) ↩︎
ibid. ↩︎
ibid. ↩︎
Aaron Clark, ‘Glencore Coal Mine in Spotlight as a Methane Hotspot Emerges’, Bloomberg, 15 Feb 2022, link ↩︎
50 per cent of the estimated 150,000 tonnes emitted from Source 3: Oaky North and Grasstree in 2018-19 ↩︎
United States Environmental Protection Agency, ‘Understanding Global Warming Potentials’, link ↩︎
National Oceanic and Atmospheric Administration (2022), ‘Increase in atmospheric methane set another record during 2021’, link ↩︎
Intergovernmental Panel on Climate Change (2014), ‘Synthesis Report of the IPCC Fifth Assessment Report (AR5)’, link ↩︎
International Energy Agency (2022), Global Methane Tracker - Overview, link ↩︎
International Energy Agency (2022), Methane Tracker Database, IEA, Paris. License: Creative Commons Attribution CC BY-SA 4.0, link ↩︎
Australian Government, National Greenhouse and Energy Reporting (Measurement) Determination (2008), link ↩︎
Australian Government Clean Energy Regulator, Estimating emissions and energy from coal mining guideline, July 2021, link ↩︎
Australian Government Department of Industry, Science, Energy and Resources (2021), National Greenhouse Accounts Factors, link ↩︎
Steve Cannane, ‘How satellites are challenging Australia's official greenhouse gas emission figures’, ABC News, 3 Dec 2021, link ↩︎
Glencore plc, Publications, link ↩︎
Glencore plc, 2020 ESG Data Book and GRI Index including SASB References, link ↩︎
Australian Government Clean Energy Regulator, Global warming potentials, 1 July 2021, link ↩︎
Australian Government Clean Energy Regulator, National Greenhouse and Energy Reporting - Safeguard facility reported emissions, 24 March 2022, link ↩︎
Glencore is yet to publish its 2021 ESG Data Book, so we’ve used granular emissions data for 2020 as a proxy for 2021. ↩︎
Steve Cannane, ‘How satellites are challenging Australia's official greenhouse gas emission figures’, ABC News, 3 Dec 2021, link ↩︎
Aaron Clark, ‘Glencore Coal Mine in Spotlight as a Methane Hotspot Emerges’, Bloomberg, 15 Feb 2022, link ↩︎
Christopher Knaus, ‘Revealed: Glencore bankrolled covert campaign to prop up coal’, The Guardian, 7 March 2019, link ↩︎
Get email updates about new ACCR research and shareholder advocacy on specific topics of interest to you.
Sign Up