The major risk ongoing geopolitical tension poses to energy security is at the forefront of the International Energy Agency’s (IEA) latest World Energy Outlook (WEO) - a timely reminder that energy security is the core mission of the IEA. But this year’s WEO does not just identify escalating conflict in the Middle East or the ongoing war in Ukraine as a risk to energy security, it also puts increased focus on the impacts of climate change – “Energy security and climate action are inextricably linked: extreme weather events, intensified by decades of high emissions, are already posing profound energy security risks.”
The rapidly accelerating physical impacts of climate change – and the growing costs of a delayed energy transition - are also linked to the affordability of energy.
“There may be downward pressure on fuel prices for a while, but energy history tells us that one day the cycle will be reversed, and prices will rise. The costs of climate inaction, meanwhile, grow higher by the day as emissions accumulate in the atmosphere and extreme weather imposes its own unpredictable price. By contrast, clean technologies that are increasingly cost-effective today are set to remain so, with greatly reduced exposure to the vagaries of commodity markets and lasting benefits for people and planet.”
On the critical question of the pace of the transition, it’s a case of fast – but not fast enough. The 2024 WEO shows continued acceleration, and as with last year’s WEO, coal, oil and gas are each projected to peak before 2030 under all scenarios. But still, “the world has the need and the capacity to go much faster.”
On policy, the good news is real-world implementation is catching up to the pledges by nations. However, while policy is not the only driver of clean energy – cost and competition for sector leadership also play a role – the WEO warns of near-term policy uncertainty, given “countries representing half of global energy demand are holding elections in 2024, and energy and climate issues have been prominent themes for voters that have been buffeted by high fuel and electricity prices, and by floods and heatwaves”. A salient warning, given the recent results of the US election.
While current trajectories place us at around 2.5°C warming by 2100, the IEA’s Net Zero Emissions (NZE) scenario describes a technically feasible pathway to remain below 1.5°C (after peaking at 1.6°C) – a path the WEO describes as “increasingly narrow but still achievable”. Whether this can be achieved is a question of political will and effective institutions.
Key highlights from the 2024 WEO
- Movement in both the Stated Policies Scenario (STEPS) and the Announced Pledges Scenario (APS) show targets are getting stronger and policies are ratcheting up.
- The 2024 STEPS pathways for both reduced coal use and growing renewable energy supply now closely align with their respective 2021 APS pathways, which shows that real-world policy development and implementation is catching up to the pledged targets of nations. The addition of 560 GW of global renewable energy capacity in the past year is an important reason for this forecast, with China contributing 60% of this.
- There are falling projections of cumulative gas consumption across all three IEA scenarios as targets become stronger and policies ratchet up. While gas use has declined over the last four WEO iterations in both the STEPS and APS, it remains well above levels modelled under the NZE scenario.
- Coal and gas with CCS have a reduced role in the latest NZE and APS pathways compared to 2021 pathways, primarily driven by the growth and reduced cost of renewable energy, and the continuing struggles of CCS technology with cost and scalability.
- Committed LNG supply expansion will add another 50% to global LNG capacity by 2030, outpacing projected demand growth in all IEA scenarios through to at least 2040.
- Existing and under construction LNG capacity is sufficient in the NZE and APS scenarios. STEPS shows adequate capacity until at least 2040, indicating no need for further LNG development.
- LNG will remain expensive for many emerging markets.
- Rapid electric vehicle (EV) adoption is expected to displace oil demand materially in all scenarios. This, combined with additional oil supplies from the USA, Canada, Guyana, and Brazil, is expected to create an oil surplus by the mid-2020s.
- While a sustained increase in gas use is not seen in any of its three scenarios, the IEA warns a shift towards circumstances that are more favourable for growth in gas demand can’t be ruled out, though this would come at the expense of clean energy progress, efficiency gains, and require LNG priced at levels that could challenge the profitability of exporters.
Ratcheting up of policy and stronger targets show that the Paris Agreement is working – but not fast enough.
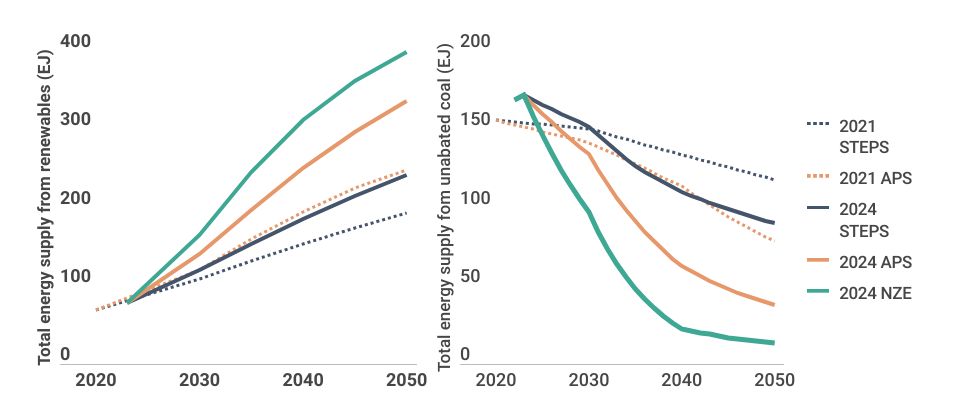
The Paris Agreement’s ‘pledge and review’ mechanism is intended to improve targets and policies over time. We can see this happening with coal and renewables projections in the 2024 STEPS, which now closely resembles the 2021 APS (Figure 1).
China’s leadership in renewables expansion is an important reason for this forecast. It added 60% of the world’s global renewable energy capacity in the past year – 260 GW of solar and over 75 GW of wind.
Figure 1: The ratcheting of climate policies driven by the Paris Agreement has accelerated renewable energy growth and reduced coal use, aligning 2024 STEPS policies with 2021 APS pledges
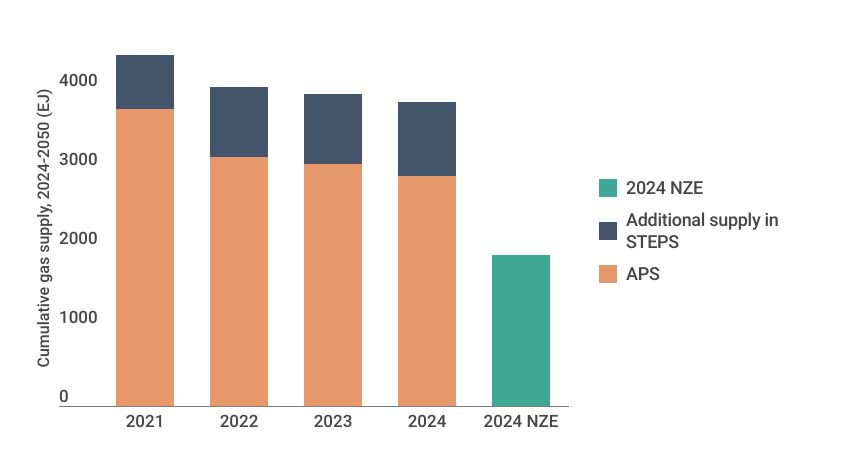
Projections of cumulative gas consumption are also falling consistently as pledges become stronger and policies ratchet up (Figure 2).
Figure 2: Gas use has declined over the last four WEO iterations in both STEPS and APS, yet remains well above levels needed for the NZE
Progress in renewable energy policy and technology has reduced and delayed the role of abated fossil fuels (coal and gas) in the NZE and APS, as CCUS technology continues to struggle with cost and scalability (Figure 3 and 4).
This is consistent with other data showing that renewables deployment is leading the energy transition rather than the decarbonisation of fossil fuels.
Figure 3: The scale of fossil fuels with CCUS and unabated fossil fuels in NZE and APS has declined since the 2021 WEO
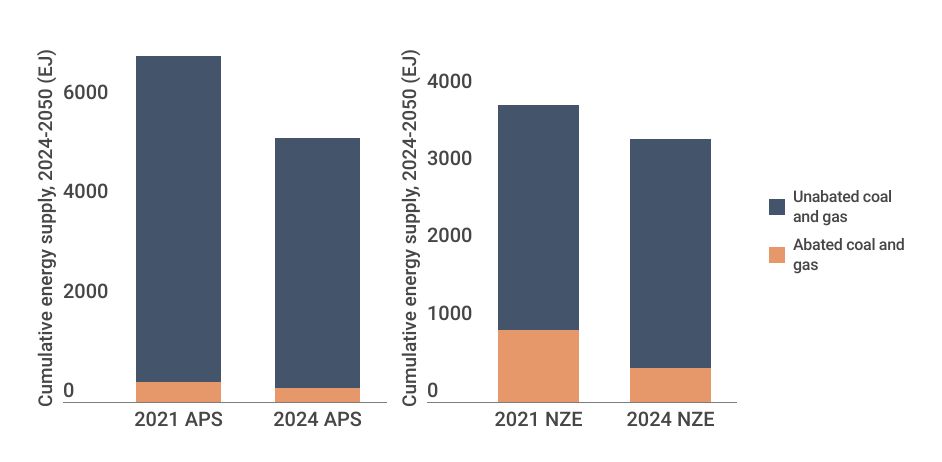
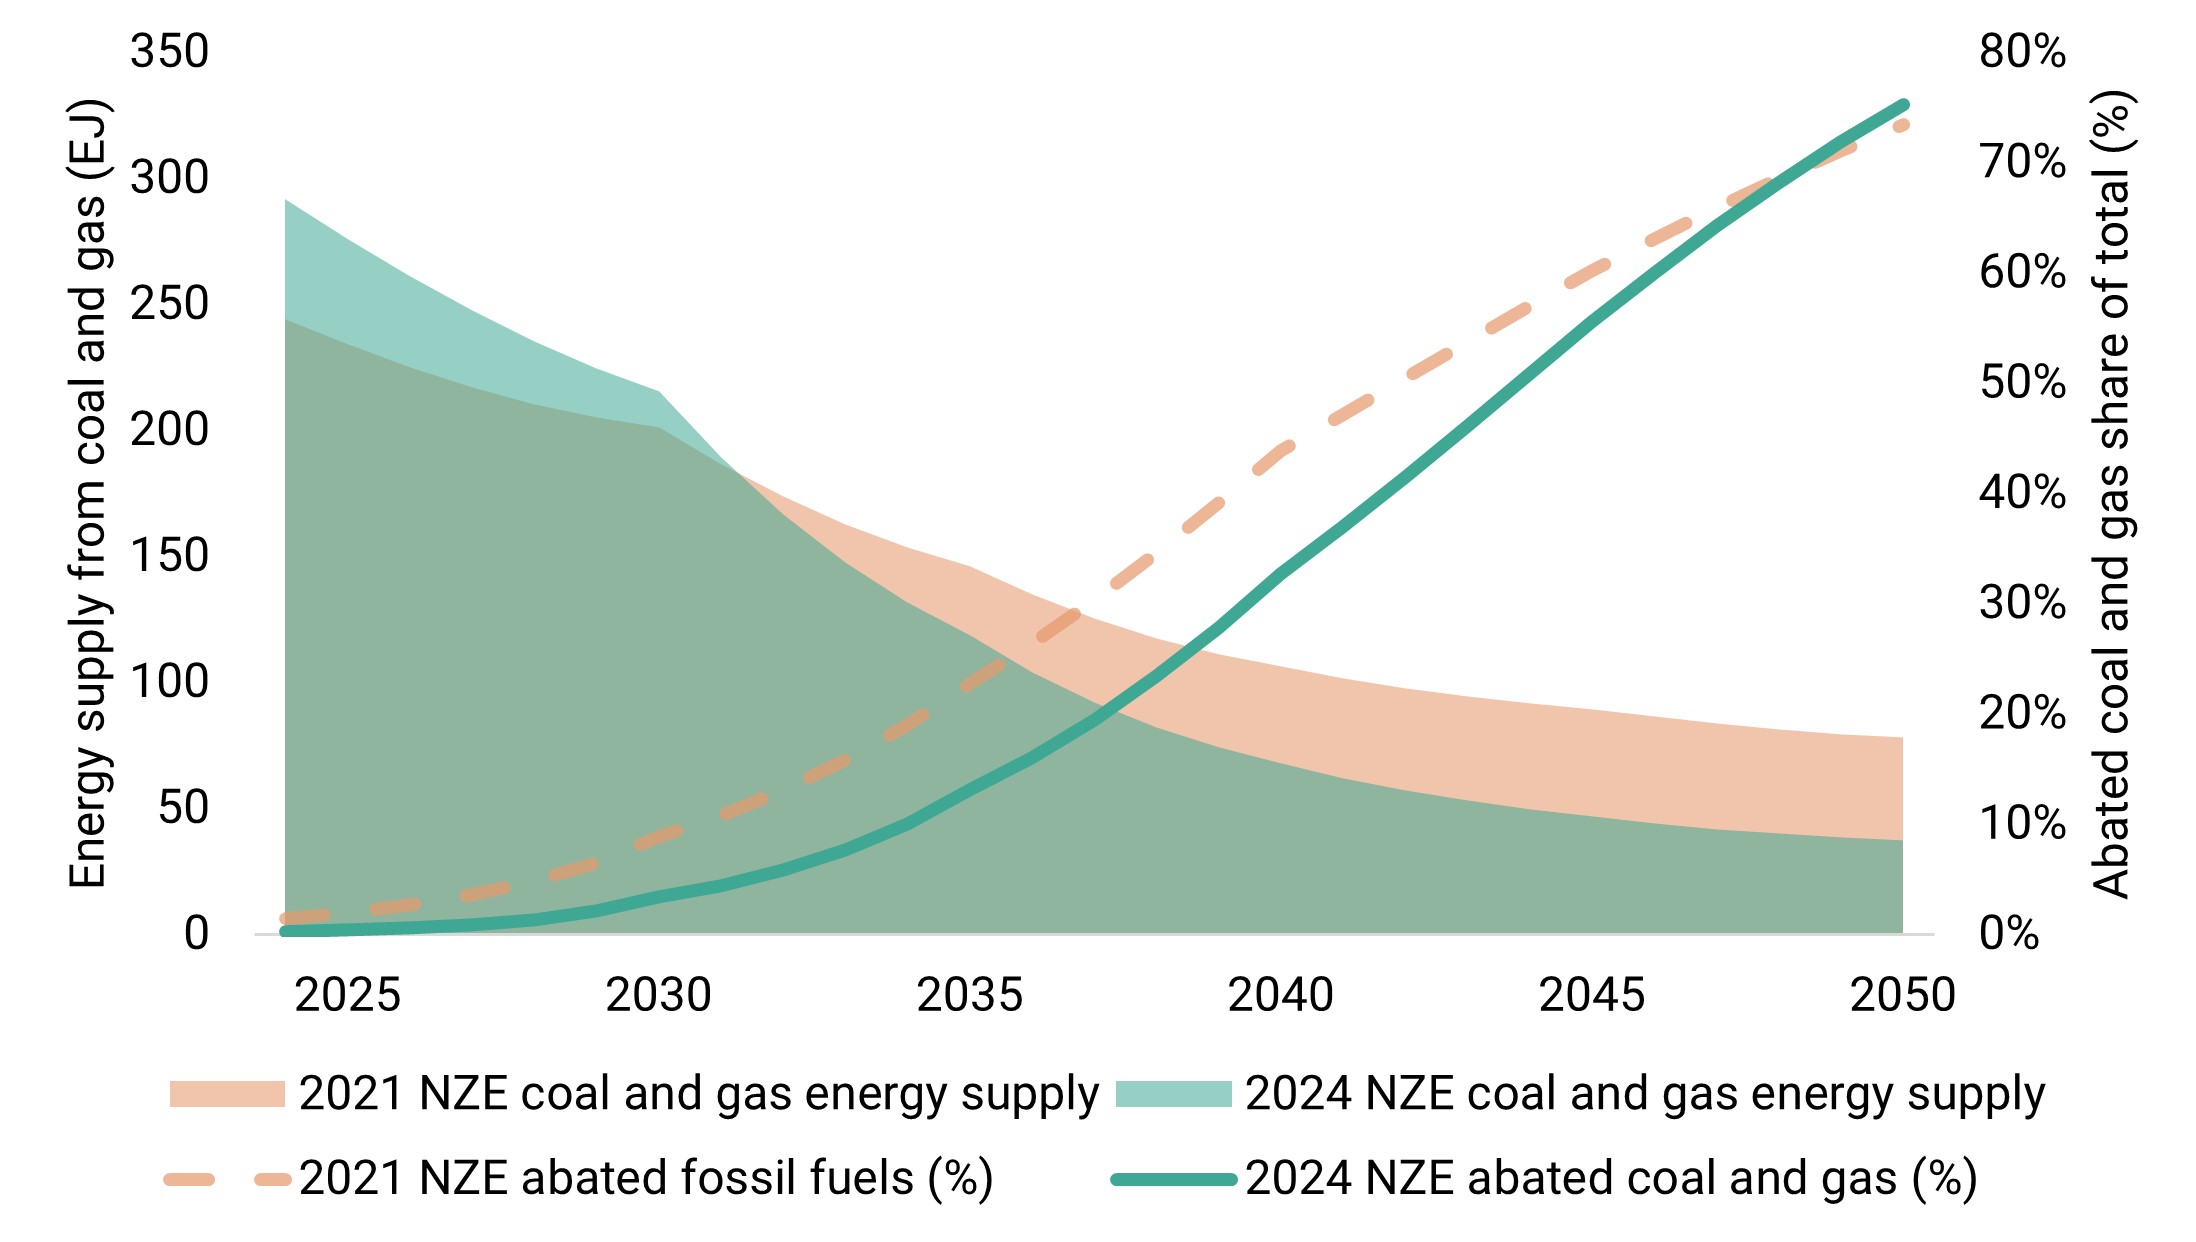
Figure 4: The role of CCUS with fossil fuels in the NZE has reduced through to 2050, reflecting delays in both technological progress and cost reduction
Despite this progress, global energy sector emissions were 37.7 Gt CO2 in 2023, a 1.3% increase from 2022 levels, and are expected to increase by 0.8% in 2024.
The LNG glut threatens profitability, but LNG still isn’t affordable for emerging markets
The IEA expects LNG export capacity to increase nearly 50% by 2030, outpacing projected demand growth in all IEA scenarios through to at least 2040 (Figure 5).
Figure 5: Existing and under construction LNG capacity is sufficient in the NZE and APS scenarios. STEPS shows adequate capacity until at least 2040, indicating no need for further LNG development
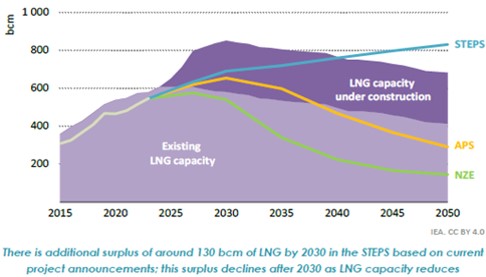
While some industry scenarios project faster LNG demand growth, the WEO notes that LNG will remain expensive for many emerging markets. Priced at US$8/MBtu, the delivered cost from many new projects, LNG is unlikely to be competitive with coal, which in India, for example, costs US$3-5/MBtu. The IEA forecasts that 70% of projects under construction would struggle to recover their invested capital in the NZE scenario, and 30% in the APS. This risk increases with each new FID.
Gas could struggle to compete with coal and renewables in many emerging markets without additional subsidies. Using limited government capital on inefficient fossil fuel subsidies would not address energy poverty, and restrict the funds available to deploy cheaper and cleaner renewables.
Rapid EV adoption and rising supply points to a softer oil market
All IEA scenarios point to oil oversupply in the mid-2020s, posing challenges for major oil producers. Led by Chinese manufacturers, EV sales are surging, and now represent 20% of new car sales worldwide — a figure expected to reach 50% by 2030 under the STEPS scenario, potentially displacing up to 6 million barrels per day of oil demand. Simultaneously, growing oil supply in the USA, Brazil, Guyana and Canada is adding pressure on oil prices, which may affect OPEC+’s management of oil supply.
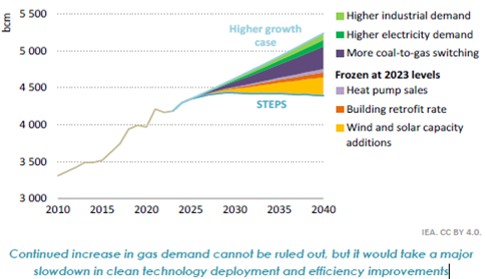
Potential gas growth could come at the expense of timely energy transition
The WEO 2024 acknowledges that “continued increase in gas demand cannot be ruled out” but makes clear that this would likely come at the expense of “a major slowdown in the deployment of clean energy technologies and in the achievement of efficiency gains” (Figure 6). It would also mean “LNG being priced for some years at levels that makes it difficult for exporters to recover their costs”.
Figure 6: The IEA notes that any rise in gas demand beyond STEPS would require a substantial slowdown in clean technology deployment and efficiency gains
Immediate action can deliver a faster energy transition and long-term energy security
The IEA is clear that “all parties need to recognise that locking in fossil fuel use has consequences,” and a faster energy transition is critical for energy security – its foundational mandate:
“Energy security and climate action are inextricably linked: extreme weather events, intensified by decades of high emissions, are already posing profound energy security risks.”
The 2024 WEO recommends policymakers can use “the breathing space from fuel price pressures” to “focus on stepping up” clean energy investments and remove “inefficient fossil fuel subsidies”.
Even in STEPS, energy demand growth through to 2035 is set to be three-times slower than in the past decade due to efficiency improvements, economic restructuring, electrification and renewables. The outlook also notes accelerating clean power growth will far outpace electricity demand growth by 2030, even when factoring in the energy demands of computing data centres, which “account for a relatively small share of total global electricity demand growth”.
While achieving NZE alignment will require a “surge in clean energy spending”, the IEA points out that near-term decisions and immediate investments in clean energy will help limit systemic risk in the long run. The benefits also go beyond longer term climate change mitigation, with price, volatility and energy security all improving in the nearer term.
Appendix — The IEA’s future energy use scenarios
Table 1: Overview of scenarios in the 2024 World Energy Outlook
|
STEPS |
APS |
NZE |
|---|
Definition |
A scenario that reflects energy-related policies across sectors and countries, including policies under development and planned manufacturing capacities for clean energy technologies. |
A scenario that assumes all global climate commitments made by governments and industries—such as Nationally Determined Contributions (NDCs), net zero targets, and goals for universal access to electricity and clean cooking—will be met in full and on schedule. |
A scenario that outlines a pathway for the global energy sector to reach net zero CO2 emissions by 2050, without relying on emissions reductions from other sectors. Achieves universal access to electricity and clean cooking by 2030. |
Objective |
Provides a conservative benchmark for assessing current policies. The gap between STEPS and APS reveals the "implementation gap" that must be closed for countries to meet their announced decarbonisation targets. |
Shows how close current pledges bring the world to the 1.5°C global warming target. The gap between APS and NZE highlights the “ambition gap” that must be closed to meet the Paris Agreement goals. |
Shows what is required across key sectors, by various actors and when, for the world to achieve net zero CO2 emissions from energy and industry by 2050, while meeting sustainable energy goals like universal energy access. |
Temperature outcome in 2100 |
2.4°C |
1.7°C |
1.5°C |
Paris-aligned |
No |
No |
Yes |
Download a PDF of Investor Bulletin: IEA's 2024 World Energy Outlook | 15/11/24
Please read the terms and conditions attached to the use of this site.