This communication is for informational purposes only and does not constitute financial, legal, or professional advice. ACCR does not hold an Australian Financial Services Licence and does not provide financial product advice. The purpose of this communication is not to provide financial product advice. Please read the terms and conditions attached to the use of this site.
Despite showing that renewable energy will be central to future energy systems, the 2025 WEO underscores the vast gap between current policies and the pace of change needed for a lower-emissions future. For investors, whether a high-risk future materialises is increasingly a matter of choice.
The 2025 World Energy Outlook (WEO) from the International Energy Agency (IEA) has been released, showing that under all scenarios - even with proactive policy support for fossil fuels in the United States - renewables grow faster than any other major energy source.
The Net Zero Emissions (NZE) scenario shows it is still possible to limit warming to 1.5°C by 2100, though only after a temporary overshoot that would require significant investment in removals technologies to return to safer levels. Under the Stated Policies Scenario (STEPS), coal and oil demand peaks by 2030, and gas demand hits a plateau in the mid-2030s. Gas demand has been revised up, though the IEA cautions “questions still linger about where all the new LNG will go”.
Not surprisingly though, it’s the IEA’s decision to resurrect the defunct Current Policies Scenario (CPS) – abandoned in 2020 – that is drawing significant attention. Under the CPS, oil and natural gas demand continue to grow to mid-century, although coal goes into decline before 2030.
However, the CPS should not be interpreted as a credible investment signal. This scenario only includes policies that are currently adopted in legislation and regulation. It assumes – implausibly – that governments won’t even introduce policies they’ve already committed to, let alone develop new ones. Because of this narrow interpretation, the IEA warns that the CPS is “not a forecast or a prediction of the way the energy system will unfold” and it should not “be interpreted as a “business-as-usual” scenario”.
Our analysis of the CPS over time shows that enacted policies have continued to evolve and place a longer-term downward pressure on fossil energy. In the 2025 CPS, cumulative energy supply from fossil fuels to 2040 is 11% lower than in the 2015 CPS, and 8% lower than the 2019 CPS – a trend likely to continue given technology and policy momentum.
Despite its limitations as an unlikely energy system scenario, investors cannot ignore the temperature warnings of the CPS: it shows warming exceeding 2°C by around 2050, reaching 2.9°C by 2100, and continuing to rise thereafter. Beyond 2°C of global temperature rise lies a sharp escalation in the risk of irreversible climate tipping points and systemic impacts that no portfolio diversification strategy can hedge against.
Whether this high-risk future materialises is a matter of choice — STEPS and CPS alike illustrate the consequences of choosing poorly. Decisions made in the coming years could lock in portfolio-wide climate disruption. The Net Zero Emissions by 2050 (NZE) is the only wise choice, delivering the most economically resilient pathway, universal energy access and reductions in household energy bills while limiting warming to below 2°C.
Key points
The CPS includes only policies currently adopted in legislation and regulation. Because of this narrow reading, the IEA has warned against treating it as a business-as-usual scenario. Examples of policies which have not been included in the CPS include:
- China - the expansion of the emissions trading system to cement, steel, and aluminium
- India - the start of the Carbon Credit Trading Scheme in 2026
- EU - anticipated operation of the EU Emissions Trading System II (EU ETS II) for transport fuels starting in 2027. The assumption of a ban of imports of Russian LNG into the European Union from January 2027 for long-term contracts
- Australia - progress towards reaching 82% renewables electricity generation target by 2030
- Japan - energy demand and supply mix of the 7th Strategic Energy Plan (2025)
- Brazil - Energy Transition Acceleration Programme (2025); Nova Indústria Brazil (2024); New Growth Acceleration programme (2023).
The CPS offers a conservative view of how quickly new energy technologies will be deployed and integrated into the energy system. It assumes slower growth in technology adoption than recent trends suggest, and slower still than the STEPS — even though STEPS itself has historically underestimated the pace of renewables growth. It assumes global energy investment remains flat to 2035, despite a 20% rise since 2015.
The increase in oil demand in the CPS is primarily due to the assumption that the shift to Electric Vehicles (EVs) currently underway is not replicated in emerging markets and developing countries. It assumes that electric vehicles (EVs) share of new car sales plateaus near 40% after 2035 – despite the share already at 25% and sales grew at 50% p.a. between 2014 and 2024. Similarly, it assumes the emerging electrification in truck transport does not continue.
Historical analysis shows that across CPS iterations, enacted policies have continued to evolve and place a longer-term downward pressure on fossil energy - a trend likely to continue given technology and policy momentum.
Battery roll-out assumptions are astounding under all scenarios: for CPS, STEPS and NZE, the rollout between 2024 and 2035 is from 77 today to 1400, 1700 and 2900GW respectively.
The 2025 WEO shows that for both developed and developing regions, the deeper the electrification and decarbonisation, the lower the fuel costs and consumer energy bills are (in real terms). This holds for fuel importers – with import bills cut by two-thirds – who also benefit from enhanced energy security. Of all scenarios, consumer energy prices and bills are highest in the CPS.
Under the 2025 Stated Policies Scenario (STEPS), this WEO has coal and oil demand peaking by 2030, and gas demand hitting a plateau in the mid-2030s, around 10% higher than current levels. Though, the IEA cautions “questions still linger about where all the new LNG will go”.
The Net Zero scenario (NZE) shows that it is still possible to limit warming to 1.5°C by the end of the century: the world has the technology, the capital and the policy instruments to achieve that. The NZE scenario shows that deep electrification – built on the current roll-out of renewables – results in the lowest fuel cost, the lowest energy bills, for advanced and developing countries alike, while providing energy security. The world will temporarily breach 1.5°C, which requires a substantial investment in removal technologies to return to a safer global temperature.
Key stewardship considerations
The 2025 World Energy Outlook highlights the vast gap between currently legislated policies and the pace of change needed for a safe and investable future. The takeaway for investors is that it is a matter of choice whether a high-risk future materialises.
STEPS and CPS alike represent a systemic, portfolio-level threat to long-term value. This should not be an abstract concern, since every sector is exposed to escalating physical risks, stranded assets, and structural economic volatility that no diversification strategy could meaningfully offset.
In this context, systems stewardship should become the industry standard for effective engagement by investors. Effective systems stewardship means using engagement, capital and influence to ensure that policy and corporate strategy align with a fiduciary’s duty to protect their portfolios from the ever-growing risks intertwined with a CPS or STEPS pathway. This includes:
- policy-engagement
- standard setting
- sector-wide and value-chain engagement.
The Current Policies Scenario
The Current Policies Scenario (CPS) models a world where only energy and climate policies currently adopted in legislation and regulation are implemented, with no further action even where governments have announced their intentions. It offers a narrow view of the global energy system, best read not as a business-as-usual scenario, but as a benchmark for stalled policy progress and a reminder of the disorderly, high-warming pathway that would follow.
The CPS is built on assumptions that are intentionally narrow, and in many cases counter to current trends in technology, investment and policy. These include:
- Global energy investment remains flat to 2035, despite a 20% rise since 2015, signalling a sharp slowdown in capital deployed across energy infrastructure and supply chains.
- The share of electric vehicles (EVs) in new car sales plateaus near 40% after 2035, constrained by weak policy support and limited charging infrastructure outside of China and Europe. This is despite EVs reaching 25% in new car sales in 2025, and having grown at 50% pa since 2014.
- Electricity grid constraints persist, limiting the expansion of solar and wind capacity and slowing the shift to lower cost clean power.
- International barriers to technology trade and investment continue, leaving global manufacturing capacity underused.
- Building codes and energy performance standards are not strengthened.
- Where policies set a range of outcomes, only the lower end is achieved, and policies are not renewed or strengthened after their time bound or target expires.
CPS over time
The CPS is not a bankable scenario but a reference point that highlights the gap between policies currently adopted in legislation and the pace of change needed for a lower emissions future. The 2025 CPS provides a lens to assess how policies in legislation have evolved over the longer-term, offering context for how enacted policy and technology have shifted the global energy system’s trajectory.
Cumulative energy supply from fossil fuels to 2040 is 8% and 11% lower in the 2025 CPS than in the 2019 CPS and 2015 CPS respectively
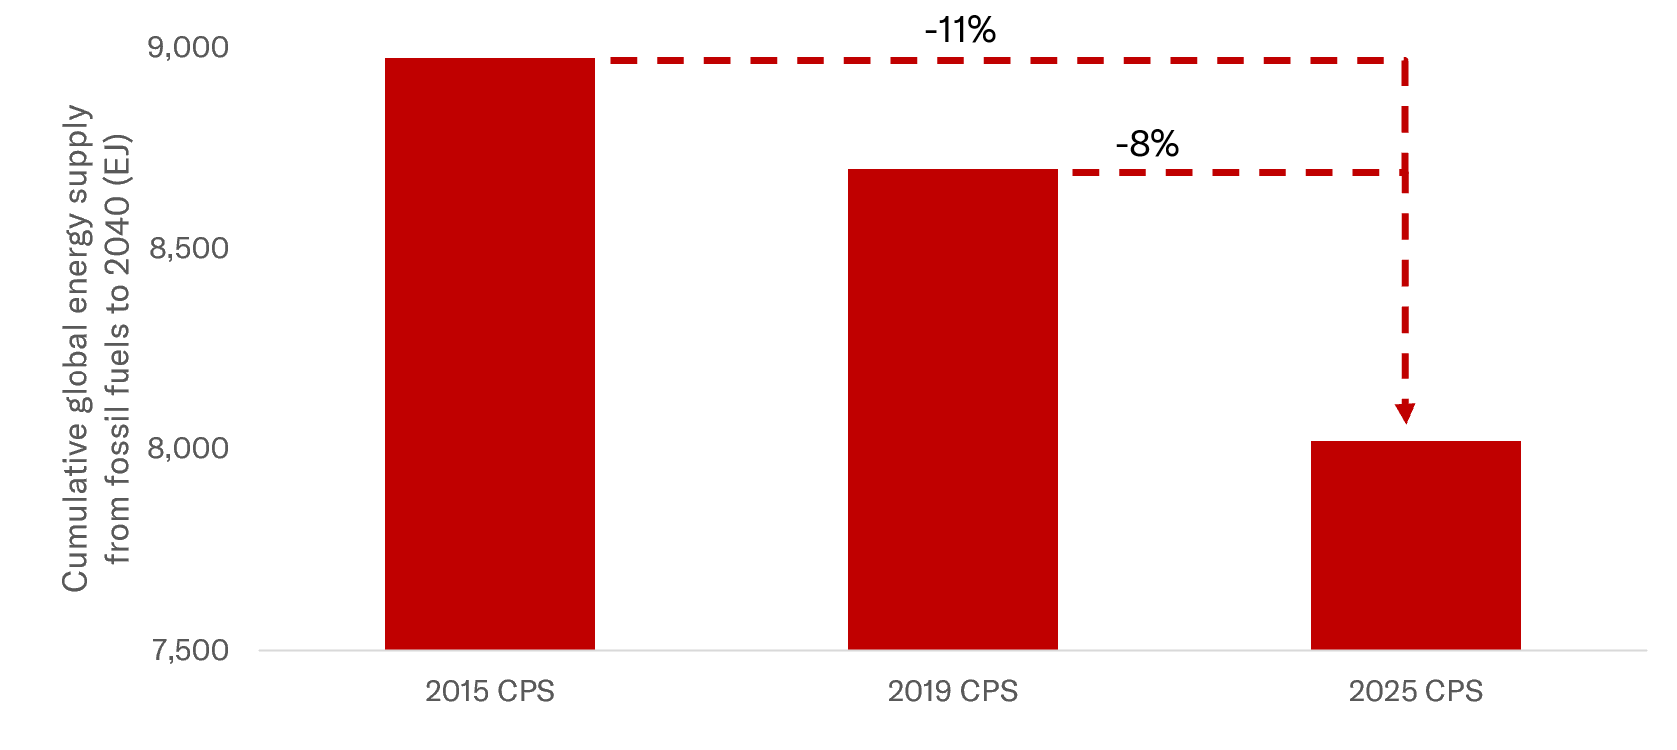
Source: ACCR analysis based on IEA WEO 2010, 2015, 2019 and 2025
The roles of coal, gas and oil under policies in legislation have evolved differently across WEO iterations. The 2025 CPS shows (i) coal peaking before 2030; (ii) gas maintaining a similar role despite increasing energy demand; and (iii) oil’s role diminishing relative to earlier CPS editions
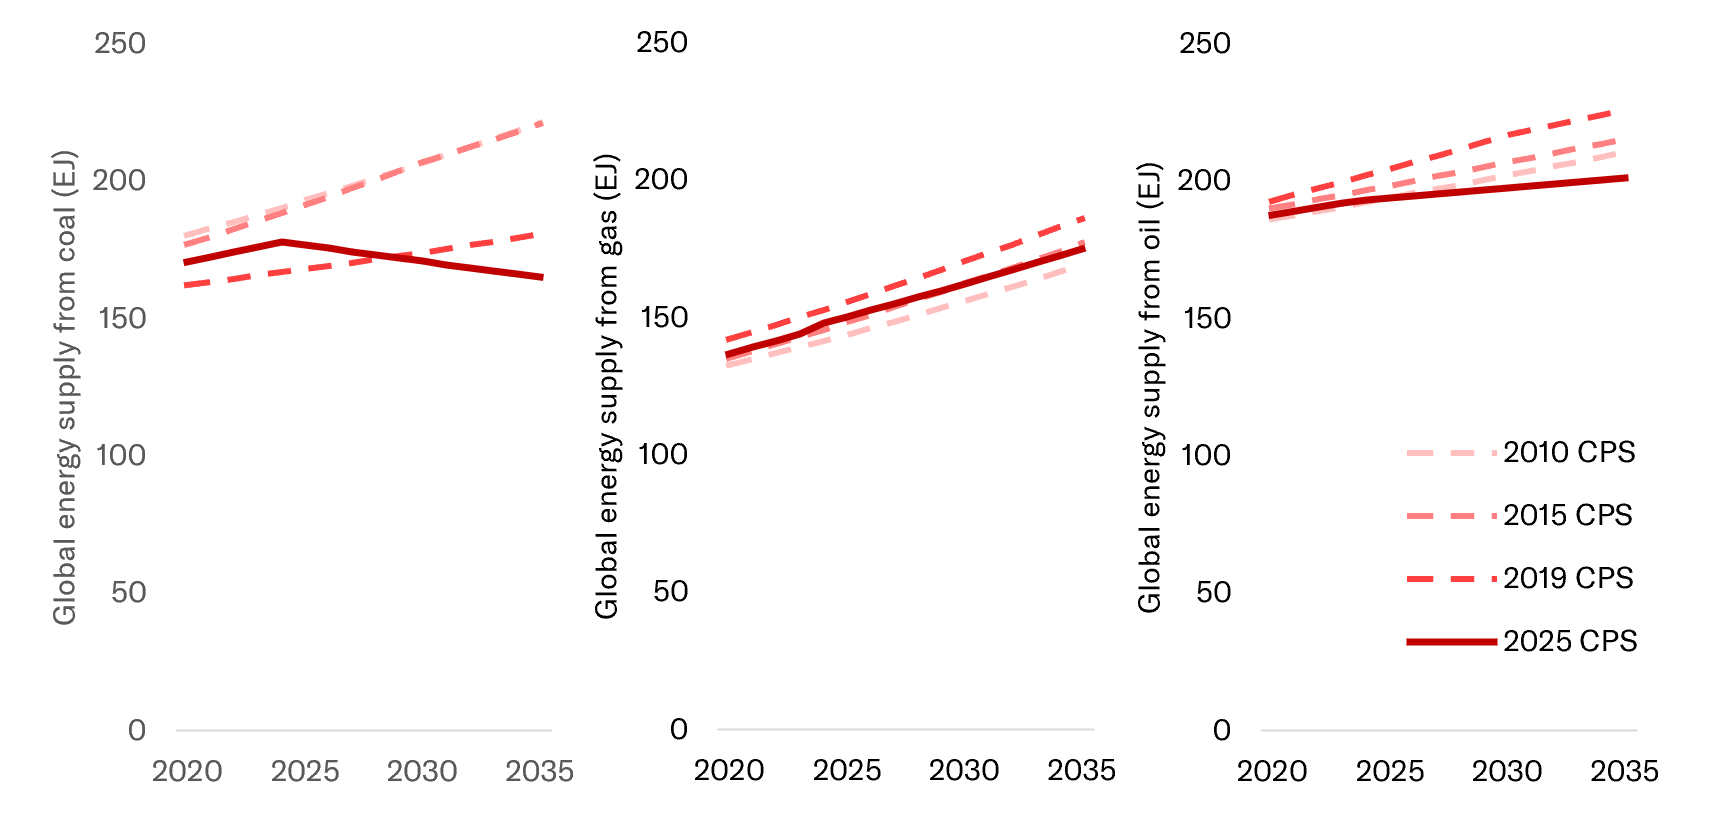
Source: ACCR analysis based on IEA WEO 2010, 2015, 2019 and 2025
Across CPS iterations, enacted policies have reshaped the role of coal, gas and oil in the energy system. The 2025 CPS shows that:
- coal is expected to peak before 2030, a shift from earlier CPS editions that showed continued growth. Energy supply from coal through 2040 is 23% and 7% lower in the 2025 CPS than in the 2015 and 2019 CPS respectively
- gas plays a more limited role than in the 2019 CPS, even as global final energy consumption has increased. This reflects evolving enacted policies and advances in electrification offsetting earlier expectations, despite rising energy use from data centres and greater heating and cooling demand under more volatile CPS temperature outcomes. Energy supply from gas through 2040 is 6% lower in the 2025 CPS than in the 2019 CPS
- oil takes on a smaller long-term role than in CPS pathways from the 2010s, which showed accelerating growth. This highlights how EV uptake, transport policies and efficiency improvements have structurally reduced oil’s position in the system. Energy supply from oil through 2040 is 10% and 6% lower in the 2025 CPS than in the 2015 and 2019 CPS respectively.
Long-term, real oil price expectations have declined across successive CPS editions, with the 2025 CPS projecting a materially lower path than prior iterations as demand growth tapers
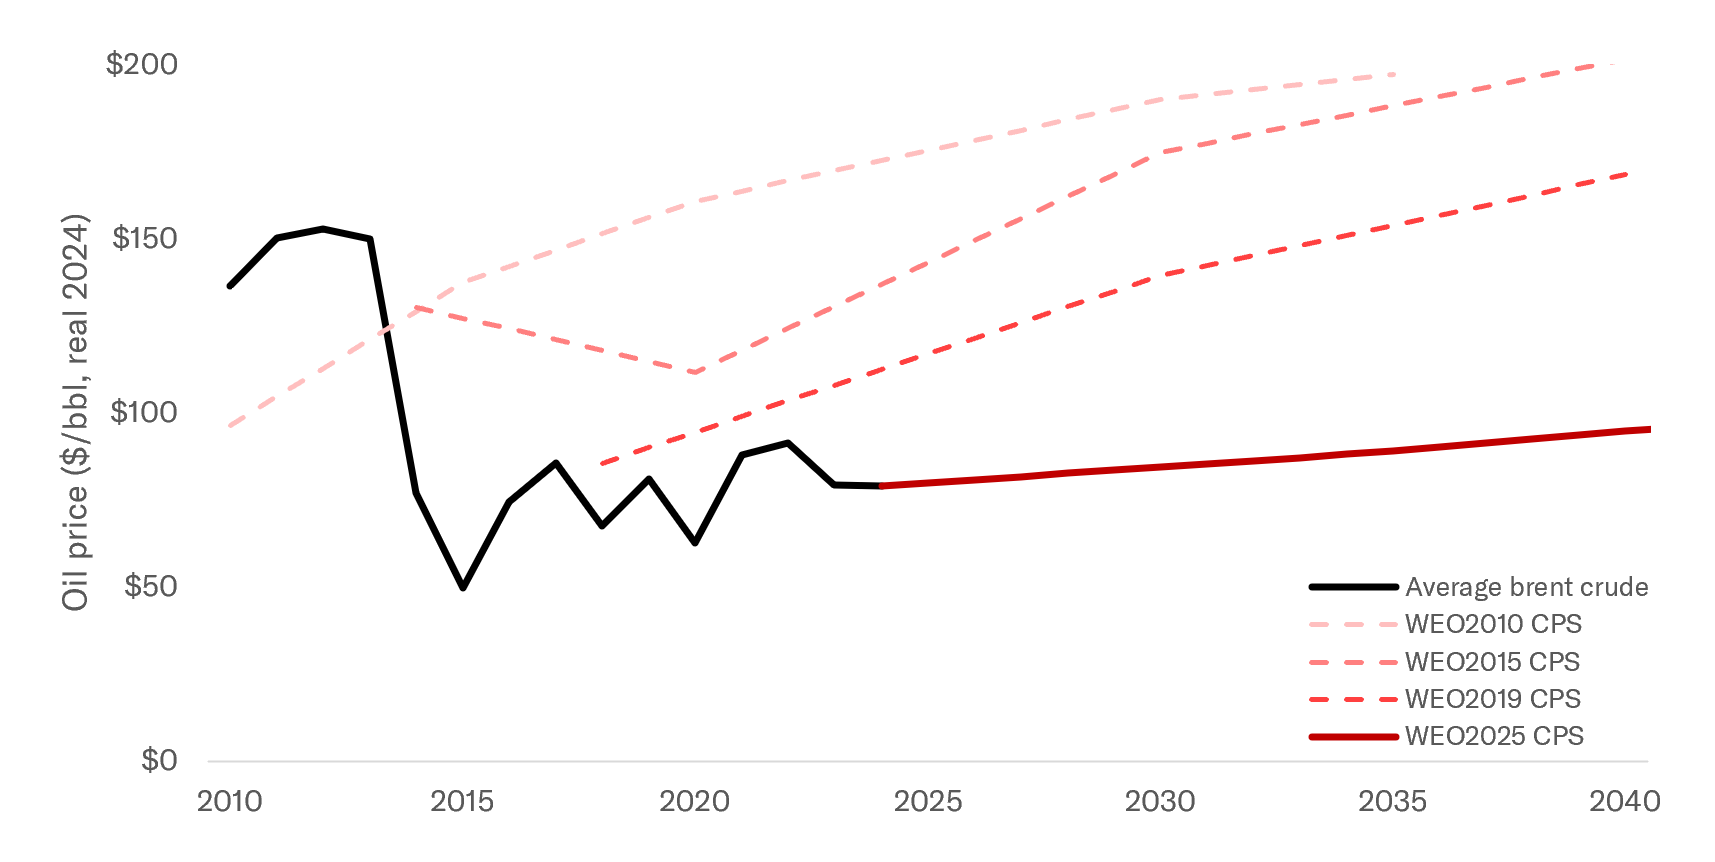
Source: ACCR analysis based on IEA WEO 2010, 2015, 2019 and 2025
Each CPS iteration shows a lower long-term oil price trajectory, with the 2025 CPS sitting well below earlier pathways. For oil and gas companies, it should reinforce the need for greater capital discipline, especially for long-dated, capital-intensive projects that are increasingly exposed to weaker price environments as policy and technology evolve.
Solar (left) and wind (right) capacity sees an exponential rise in the 2025 CPS, which was not the case in previous editions
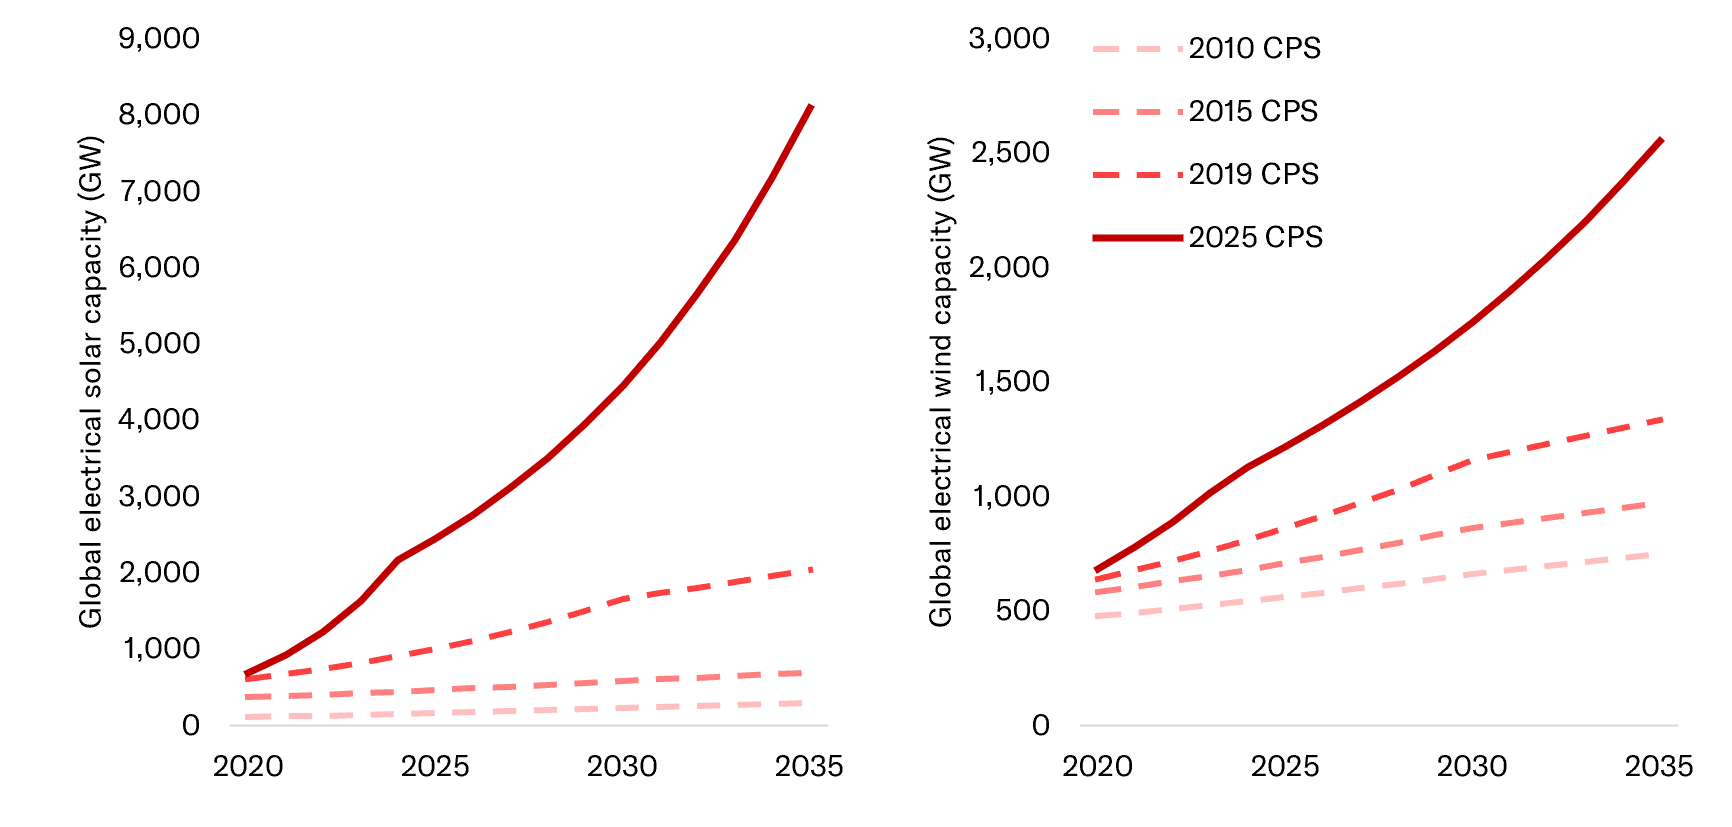
Source: ACCR analysis based on IEA WEO 2010, 2015, 2019 and 2025
The cost reductions, policy support and deployment of solar and wind across successive CPS editions offer striking takeaways. In the 2025 CPS:
- solar capacity expands far more rapidly than in previous iterations, with additions through 2040 over 5 times and nearly 24 times higher than in the 2019 and 2015 CPS respectively
- wind capacity shows a similarly accelerated pathway relative to previous editions, though at a smaller absolute scale. Additions through 2040 are nearly 3 times and 5 times higher than in the 2019 and 2015 CPS respectively.
Battery storage has far outpaced earlier expectations, already reaching three times the level outlined in the 2019 STEPS today. The 2025 CPS reinforces this trajectory, with storage levels projected to be about six times higher than the 2019 STEPS by 2035.
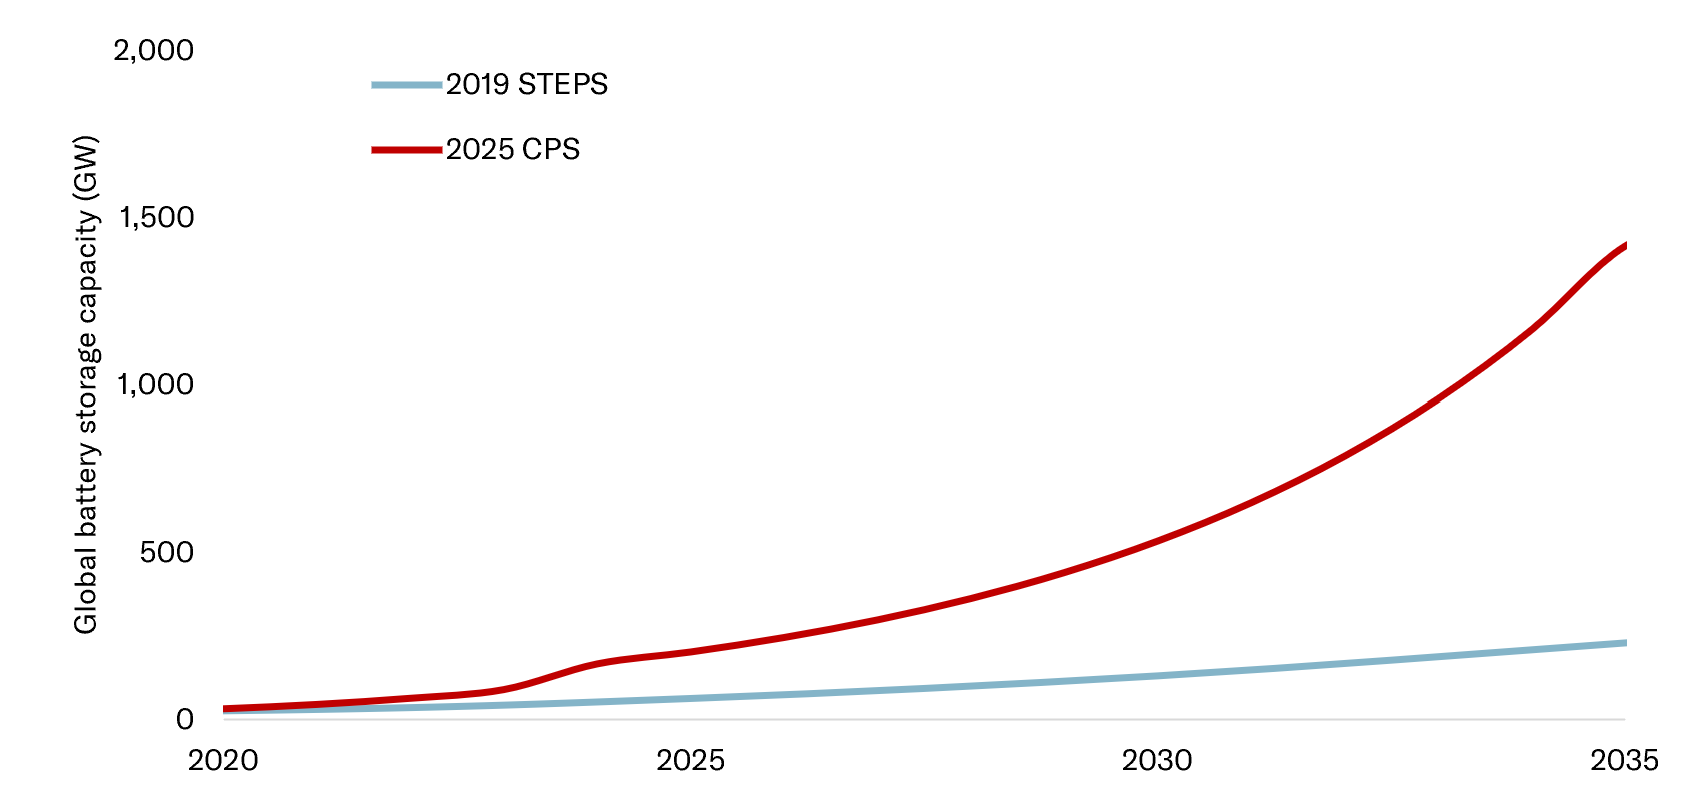
Source: ACCR analysis based on IEA WEO 2019 and 2025
Electricity generation from coal and gas (left) is much lower in the 2025 CPS than previous editions and now faces significant risk of further displacement from wind and solar (right), which sees exponential grid penetration in the 2025 CPS relative to previous editions
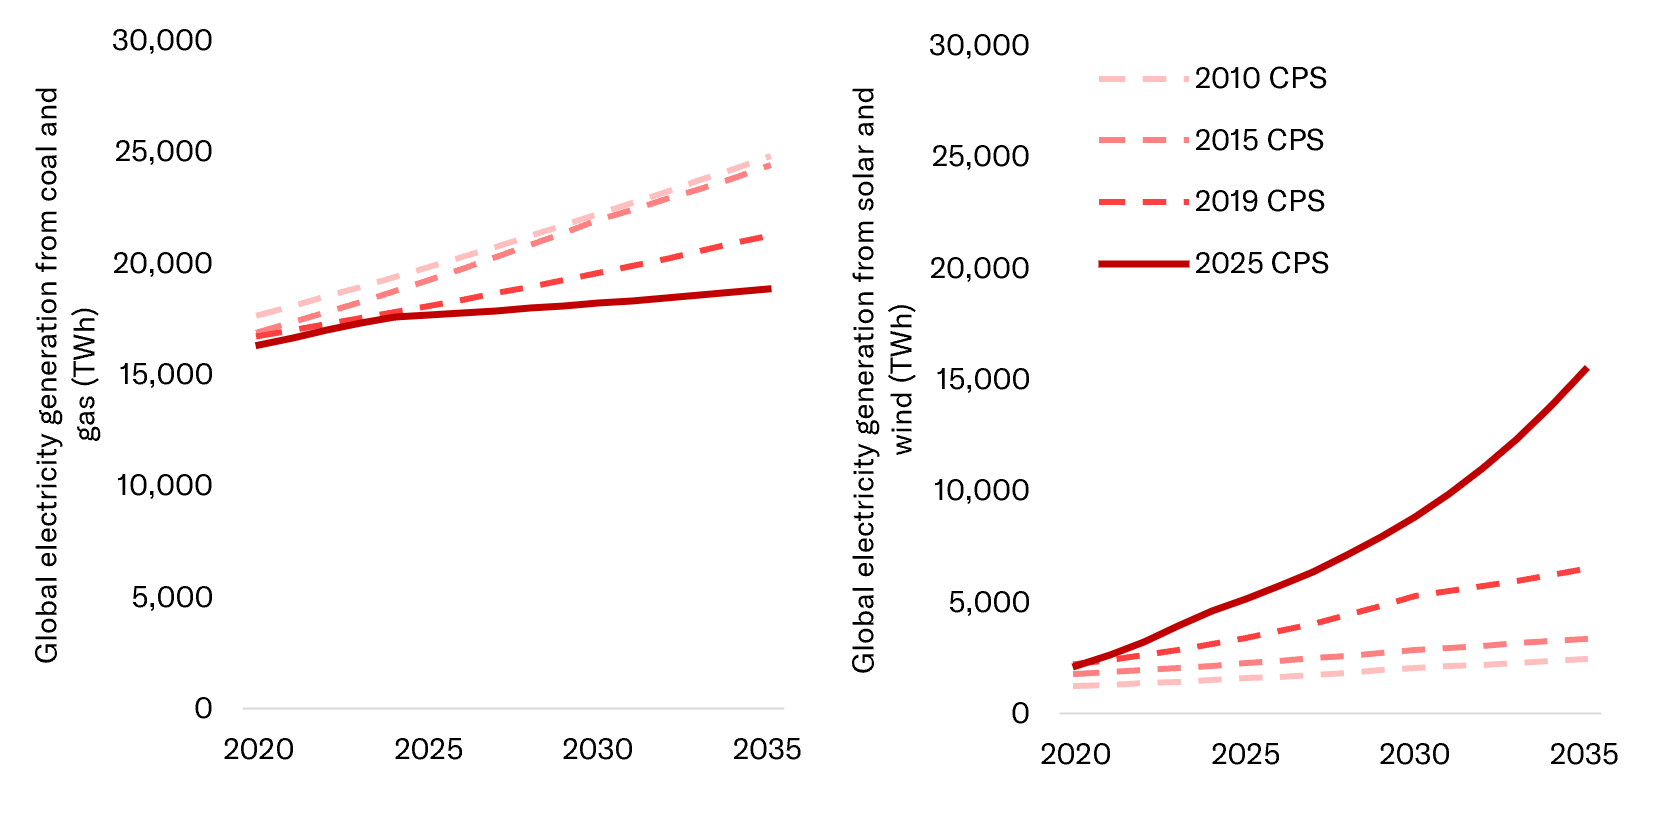
Source: ACCR analysis based on IEA WEO 2010, 2015, 2019 and 2025
One challenge that variable renewables face is that their generation has been dependent on the weather, limiting their ability to supply round-the-clock power. However, in the 2025 CPS, significant cost reductions in battery storage have meant that increasing grid penetration from wind and solar are eroding the electricity generation outlook of coal and gas. In the 2025 CPS, cumulative electricity generation to 2040 from:
- coal and gas is 11% and 21% lower than in the 2019 and 2015 CPS respectively
- solar and wind is 112% and 297% higher than in the 2019 and 2015 CPS respectively.
The point of intersection where solar and wind generation overtake coal and gas appears in the late 2030s in the 2025 CPS. This point is expected to move earlier as policies strengthen, yet it remains well behind the pace required in the NZE scenario

Source: ACCR analysis based on IEA WEO 2010, 2015, 2019 and 2025.
The CPS and climate impacts
The Current Policies Scenario (CPS) projects that global temperatures will breach 2°C around 2050 and rise to 2.9°C by 2100. By contrast, the Paris Agreement commits to holding increases in global temperatures to well below 2°C above pre-industrial levels by 2100.
The “well-below 2°C” threshold is not arbitrary. It articulates the threat posed by warming of this magnitude and is embedded in the Paris Agreement because of the significantly increased risk of catastrophic and irreversible climate impacts that emerge beyond this threshold.
- Effects of changing extreme weather and climate events become system-wide
Beyond 2°C of warming, significant shifts in global weather and climate patterns mean that the physical impacts will be so extensive that disruptions will not be localised or isolated in nature. Instead, climate impacts will be widespread and interconnected, cascading across social, environmental and economic systems. The impacts will be imprinted on all countries, all regions and all aspects of society and economic activity, driving productivity losses, widespread crop failure and yield loss, frequent damage to infrastructure, and disruptions to supply chains.
- We open the door to climate tipping points
Above 2°C, there is increased risk of severe and irreversible consequences from climate tipping points. A tipping point occurs where a small change in the Earth's climate system leads to a profound, nonlinear shift to another state.
We have already reached the first of many Earth system tipping points as coral reefs have been tipped into a state of decline and dieback. Every increment of warming above 1.5°C on the CPS pathway to 2.9°C brings us closer to other climatic tipping points, including the collapse of the West Antarctic Ice Sheet; the dieback of the Amazon Rainforest; and weakening or even collapse of the Atlantic Meridional Overturning Circulation.
- Changes in climate move beyond adaptation measures
Beyond 2°C, systems will be pushed beyond their capacity to adapt and climate impacts cannot be avoided, reduced or managed through adaptation measures.
- Heatwaves will be more frequent, severe and extensive. With heat and humidity levels reaching deadly levels in several regions, billions of people will experience heat extremes which will lie outside the bounds of the entirety of past human experience, and beyond the engineered operating limits and design envelopes of our energy infrastructure.
- Supercharged tropical storms will occur that are worse than 2025’s extraordinary Hurricane Melissa and Super Typhoons Fung-wong and Ragasa. At 2°C, a 5% increase in tropical cyclone maximum wind speed is projected relative to recent observations, as well as increases in storm surge heights, rainfall rates and amounts. The proportion of tropical cyclones reaching the most extreme category 4 and 5 intensity level is projected to increase.
More warming and more extreme heat will also impact energy infrastructure resilience
Higher temperatures will translate into a need for additional electricity generation capacity to deal with higher peak demand – which in today’s energy system leads to higher emissions. The WEO 2025 says that if the weather in 2024 had been the same as in 2023, about half of the increase in global emissions would have been avoided. Higher peak demand is driven by higher incomes, warmer climates and more extreme heat. The cumulative increase raises peak demand by over 15% by 2035 when global temperature reaches 1.6-1.7°C in STEPS, and the increase is more significant in CPS.
More extreme weather reduces the reliability of energy systems, in particular transmission and distribution grids but also water-dependent assets like hydro power and coal-fired generation.
Download a PDF of Investor Bulletin: IEA 2025 World Energy Outlook | 13/11/2025