11th April 2024
Publication Information
Download Publication
- 849 KB PDF
- 11th April 2024
Stay Informed
Get email updates about new ACCR research and shareholder advocacy on specific topics of interest to you.
Sign UpWhen Woodside launched its 2023 Climate Transition Action Plan (CTAP) in late February, CEO Meg O’Neill told investors that the company’s oil and gas expansion plans are supported by science.
"Now, for some stakeholders, to be Paris-aligned means no new investment in oil and gas, but let’s have a look at the science."[1]
This is crucial information: investors should be wary of investment decisions, which are not Paris-aligned. In its 2023 CTAP, Woodside uses the scenarios from the Intergovernmental Panel on Climate Change (IPCC) Sixth Assessment Report (AR6) to show that oil and gas use can be resilient in a world that decarbonises in line with the Paris goals of limiting warming to 1.5°C.
"In their [IPCC] scenarios there is still a continued role for oil and gas out to 2050 and beyond … we base our work on the work of these global scientists who give us confidence that the demand for our products will be robust."[2]
Scenarios are a great tool to explore possible futures. However, they require transparency and an understanding of assumptions to warrant meaningful use. Woodside’s use of scenarios in its CTAP gives an incomplete and at times misleading picture, which shows a larger role for oil and gas in Paris-aligned pathways than is possible today.
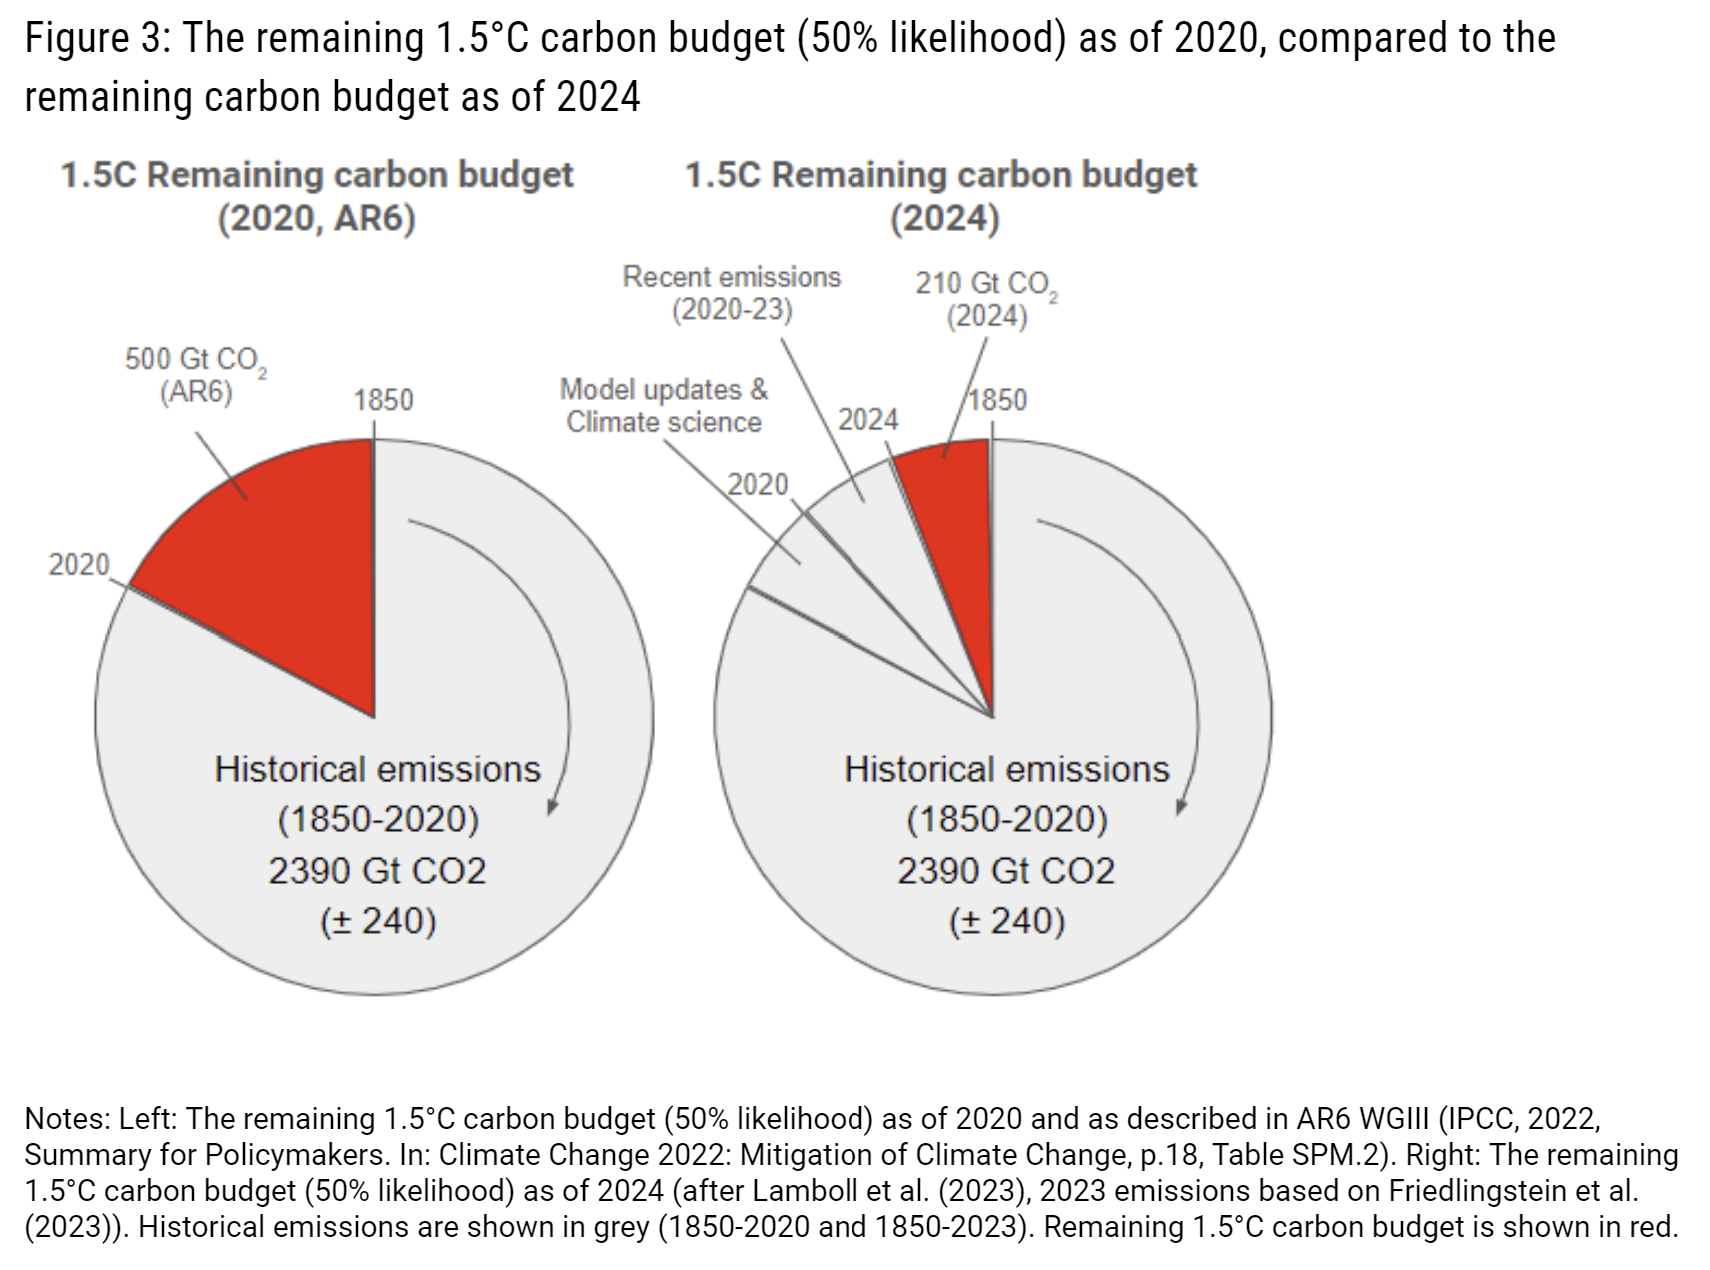
The IPCC AR6 scenarios relied upon by Woodside were published in April 2022, but the deadline for peer-reviewed literature was December 2020. Since then, global emissions have increased and the science community has refined its understanding of the impact of non-CO2 gases. This means that the remaining 1.5°C carbon budget used in IPCC AR6 scenarios is more than twice what we now have available.
By using these dated IPCC scenarios, Woodside shows a larger role for oil and gas in Paris-aligned pathways than is possible today.
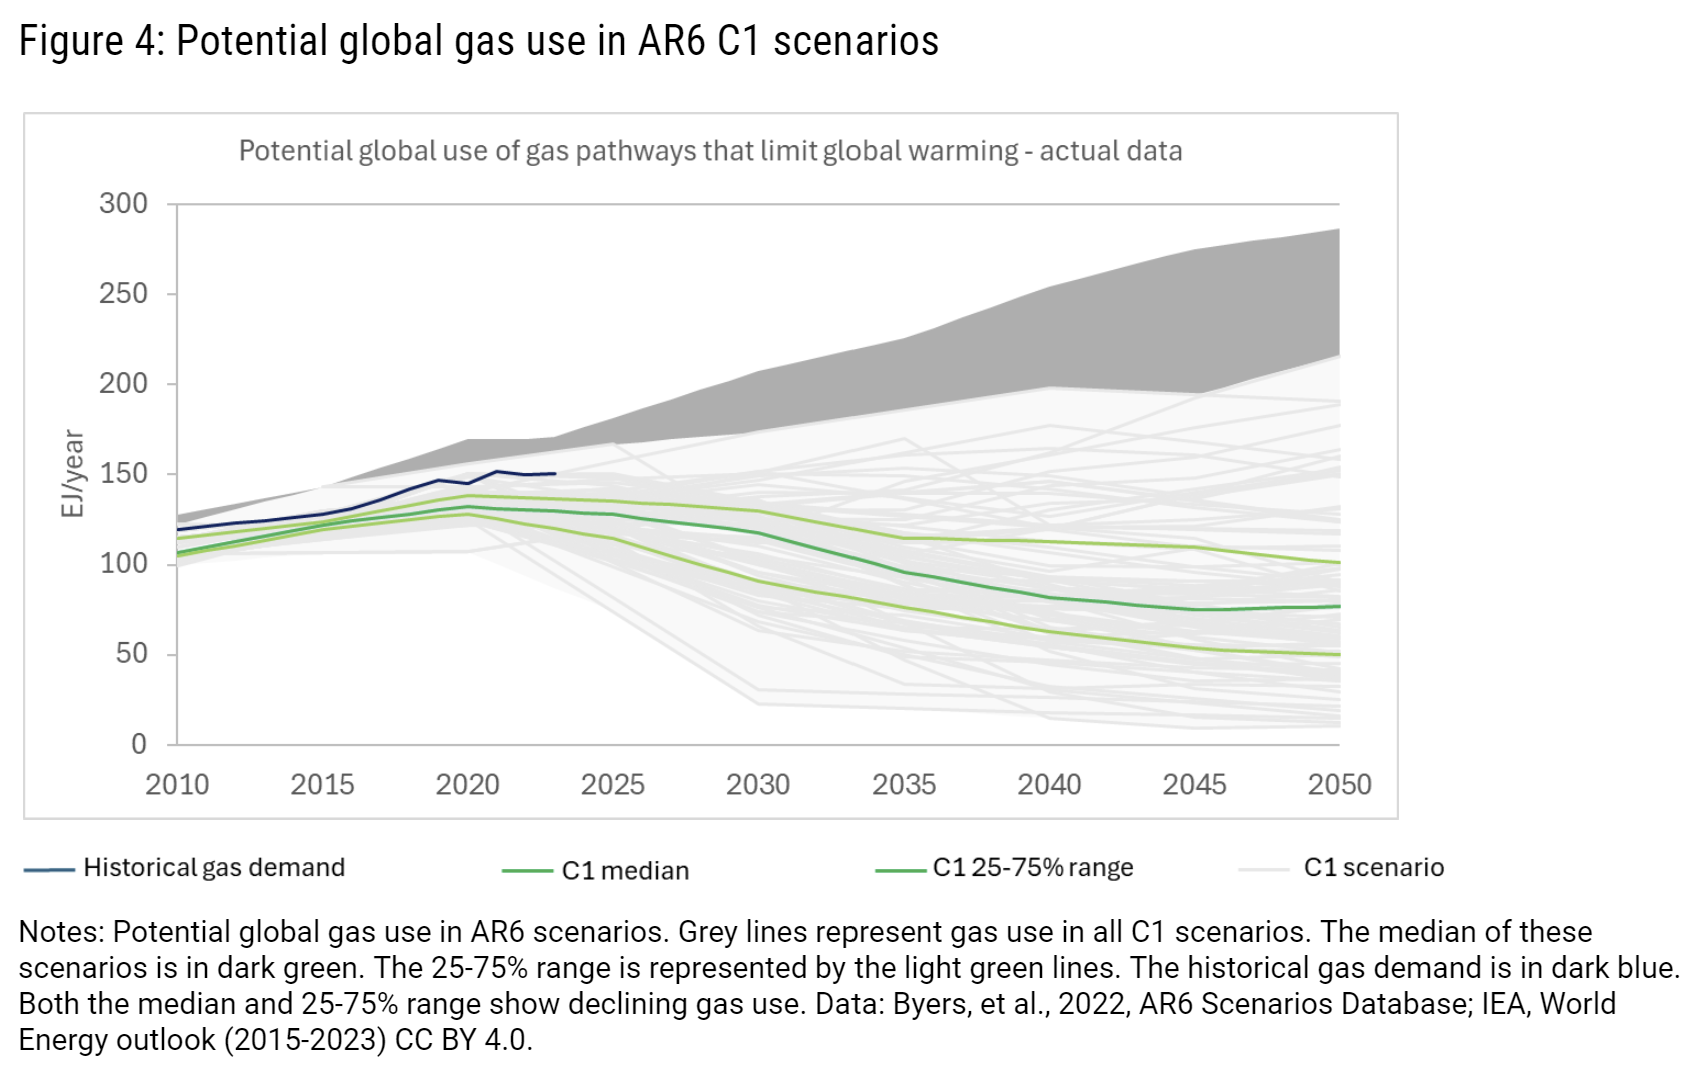
Woodside’s charts in the CTAP only show the range of oil and gas use in the IPCC AR6 scenarios. When the underlying scenario data is included, it is clear that the majority of C1 scenarios show declining oil and gas use.
Scenarios contain a range of assumptions and by isolating one, such as oil or gas use, Woodside conceals the key dependencies. In scenarios that accommodate oil or gas growth, there are invariably unrealistic assumptions relating to declines in other fossil fuels or uptake in CO2 removal technologies.
Woodside inappropriately blends IPCC and IEA scenarios in its CTAP charts, which misrepresents key conclusions of the IEA.
Woodside’s attempt to portray new gas projects as consistent with 1.5°C of warming is contrary to the latest science.
It is recommended investors and companies use Paris-aligned scenarios that are updated annually, factoring in recent emissions data and changes in scientific understanding. Options include:
Scenarios are a great tool to explore possible futures. In a carbon-constrained world, there is a lot of emphasis on scenarios that lead to a temperature-specific outcome.
In its 2023 CTAP, Woodside has used scenarios from the IPCC AR6 to convey that oil and gas use can be resilient in various pathways that decarbonise in line with the Paris Agreement - see Figure 1 and Figure 2. In this Climate Science Insight, ACCR explains why these graphs are problematic, and could lead investors to reach conclusions not grounded in the best available science.
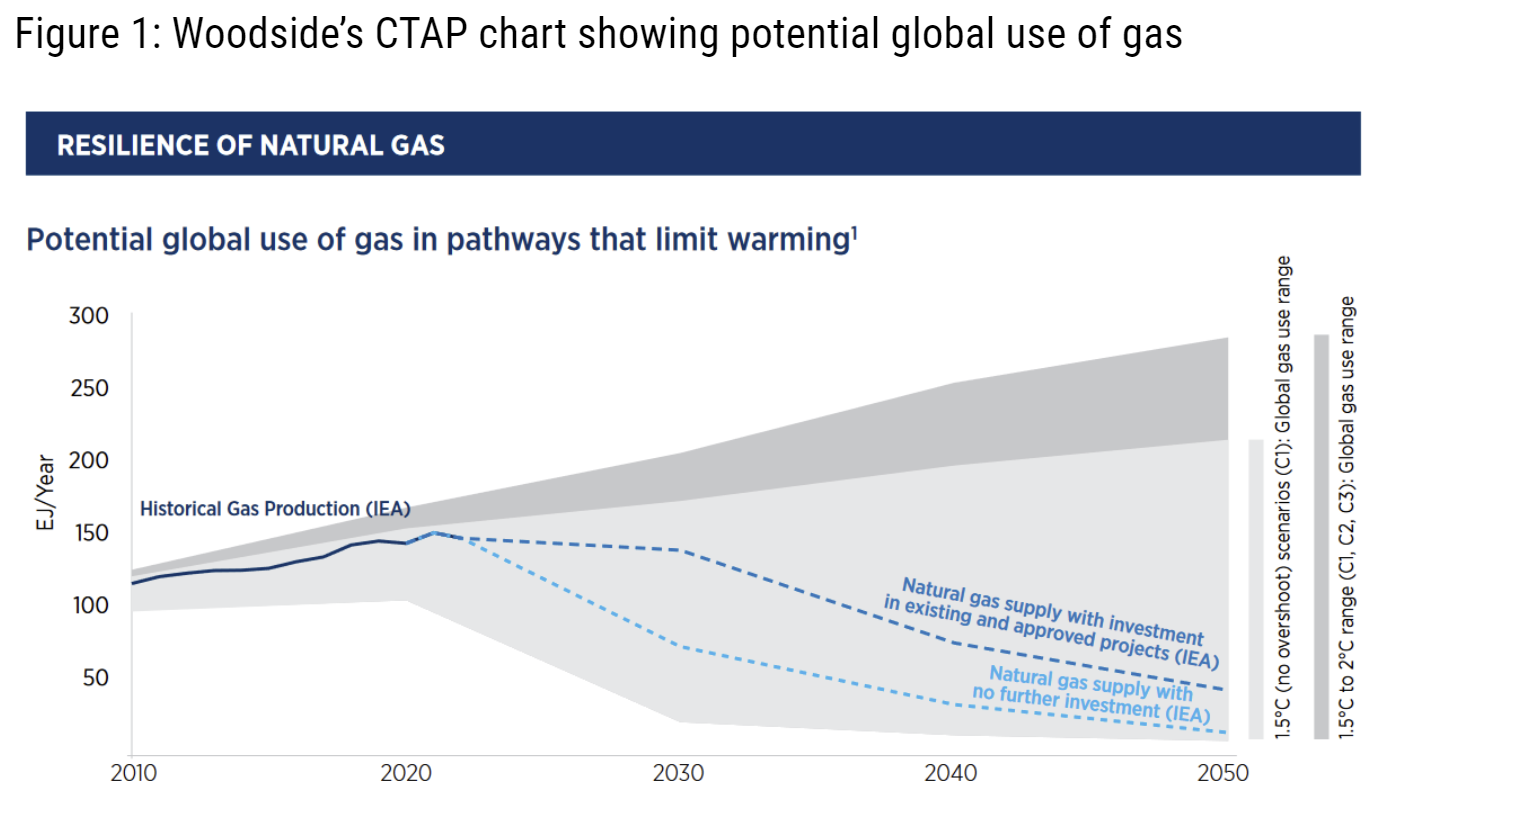
Source: Screenshot of the chart on page 7 of Woodside’s Climate Transition Action Plan and 2023 Progress Report
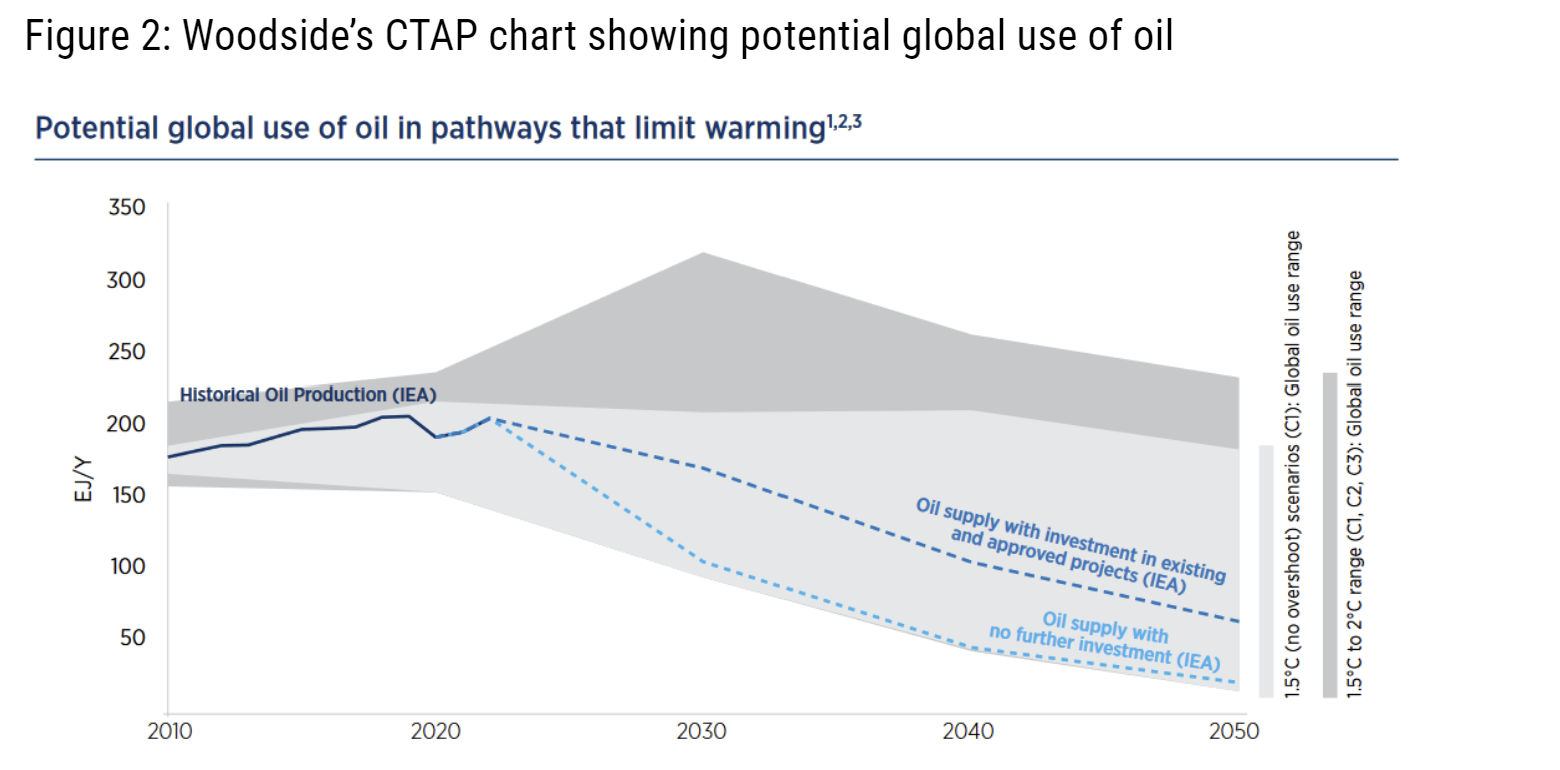
Source: Screenshot of the chart on page 45 of Woodside’s Climate Transition Action Plan and 2023 Progress Report
Since the release of the IPCC AR6 scenarios in 2022, which were based on a scientific understanding from 2020, estimates of the remaining 1.5°C carbon budget (with a 50% likelihood) have been drastically revised downwards, from 500Gt CO2 to around 210 Gt CO2 (Figure 3).[3] This update is due to the impact of recent emissions increases and better quantification of uncertainties like the impact of non-CO2 emissions.
The C1 scenarios, which were assessed by the IPCC during the AR6 reporting cycle, do not take into account the emissions since 2020.[4] Therefore, the C1 ranges for oil and gas pathways do not represent the range that we are left with in 2024 and are not a reliable measure for Woodside to use as justification for sanctioning more projects. In Paris-aligned futures, oil and gas cannot be as resilient as Woodside claims it is.
This is not the first time outlooks have changed and scenarios have needed to be updated. However, as the carbon budget is further depleted and global emissions remain stubbornly high, scenarios are becoming obsolete at a faster rate, meaning it is increasingly important for users of scenarios to be attentive to their age and assumptions. For example, in the AR6 WGIII (2022), it was noted that because it had become more difficult to limit global warming to 1.5°C due to increases in emissions, different assumptions needed to be factored into the scenarios.[5] In this context, use of the IEA NZE can be beneficial, since the IEA updates its NZE 1.5°C-aligned scenario annually to factor in new information.[6]
In addition to the IEA NZE, it would be prudent for Woodside to explore the NGFS phase 4 scenarios.[7] The NGFS scenarios are:
The reason for the significant time lag between the assumptions used in the AR6 and where we are today, has to do with the IPCC process.
The IPCC assesses the science related to climate change, it does not conduct research, nor does it create scenarios. The AR6 stands for the 6th Assessment Report cycle. This cycle kicked off in earnest after the release of the last AR5 reports in 2014. During the AR6 cycle the IPCC released reports with contributions from the 3 IPCC working groups (WGI, WGII and WGIII), 3 special reports and a synthesis report integrating the main findings of the AR6 reports.
Crucial for literature and research is the deadline by which research has to be submitted for publication in peer-reviewed journals. The literature deadline for AR6 WGIII, which also contains the assessment of scenarios available at the time, was December 2020. Those scenarios that met the vetting criteria became part of the scenarios assessed in the AR6 WGIII report, which was published in April 2022, after several months of pandemic-induced delay.
This means there is a significant time lag between the assumptions used in the AR6 scenarios, the publication of the AR6, and the reality of today’s available carbon budget.
Woodside’s CTAP (see Figure 1 and 2 above) shows the range of oil and gas use possible under a AR6 C1 scenario, not the C1 scenario data. By showing the range, represented by the light grey area, Woodside purports to demonstrate that oil and gas demand is resilient under Paris-aligned pathways.
However, the light grey area in Woodside’s CTAP does not represent a uniform “solution space” of possible oil and gas use. The scenario data describes discrete trajectories, and looking at them in this way is far more illuminating than considering them as a range.
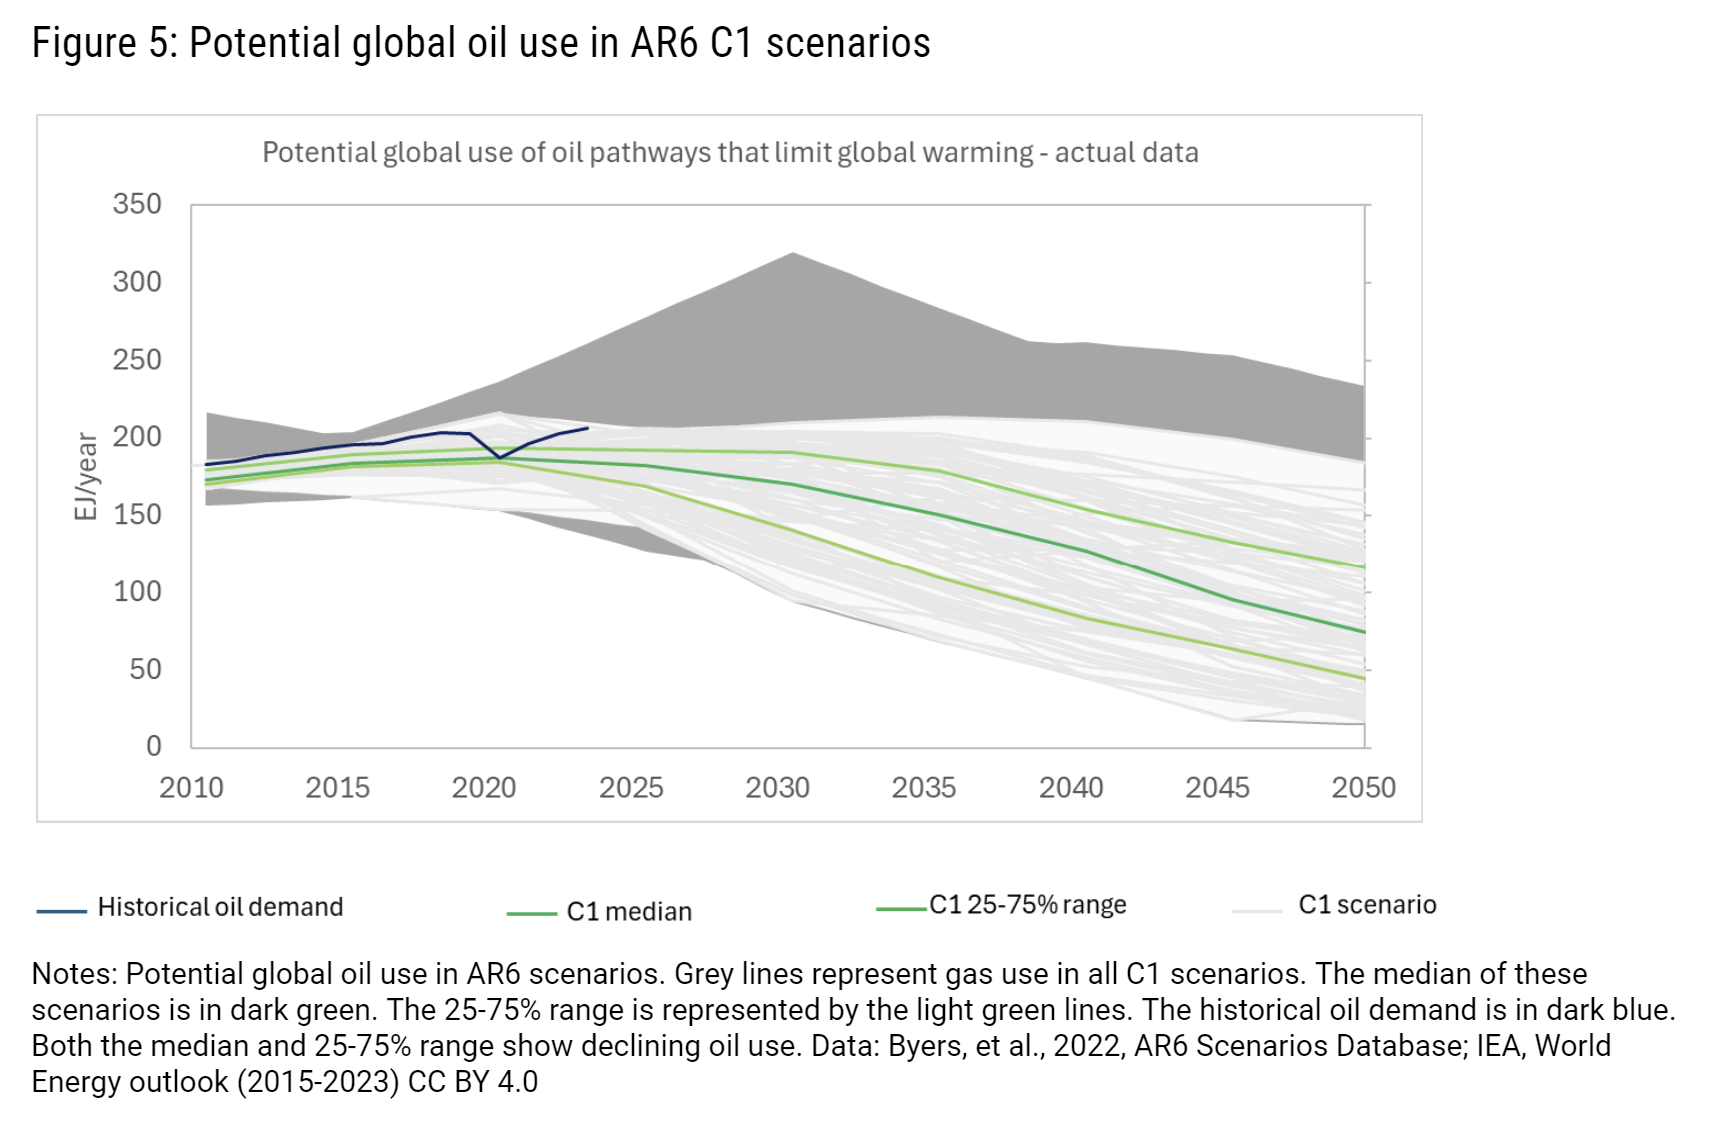
The actual data for the C1 oil and gas range would look like Figure 4 and 5 below, in which ACCR has overlaid the discrete trajectories of all 97 C1 scenarios.[8]
Figure 4 shows that for gas:
Figure 5 shows for oil:
Figures 4 and 5 also show again why using AR6 scenarios in today's context is problematic. Recent historical oil and gas use (the dark blue line) already sits at the high end of the C1 range. Most scenarios work with lower historical demand. This means that most scenarios have lower cumulative oil and gas use than the real world, and hence lower historical emissions, which has the effect of artificially inflating the remaining carbon budget.
Each scenario contains assumptions. Without understanding these assumptions a full picture is not possible.
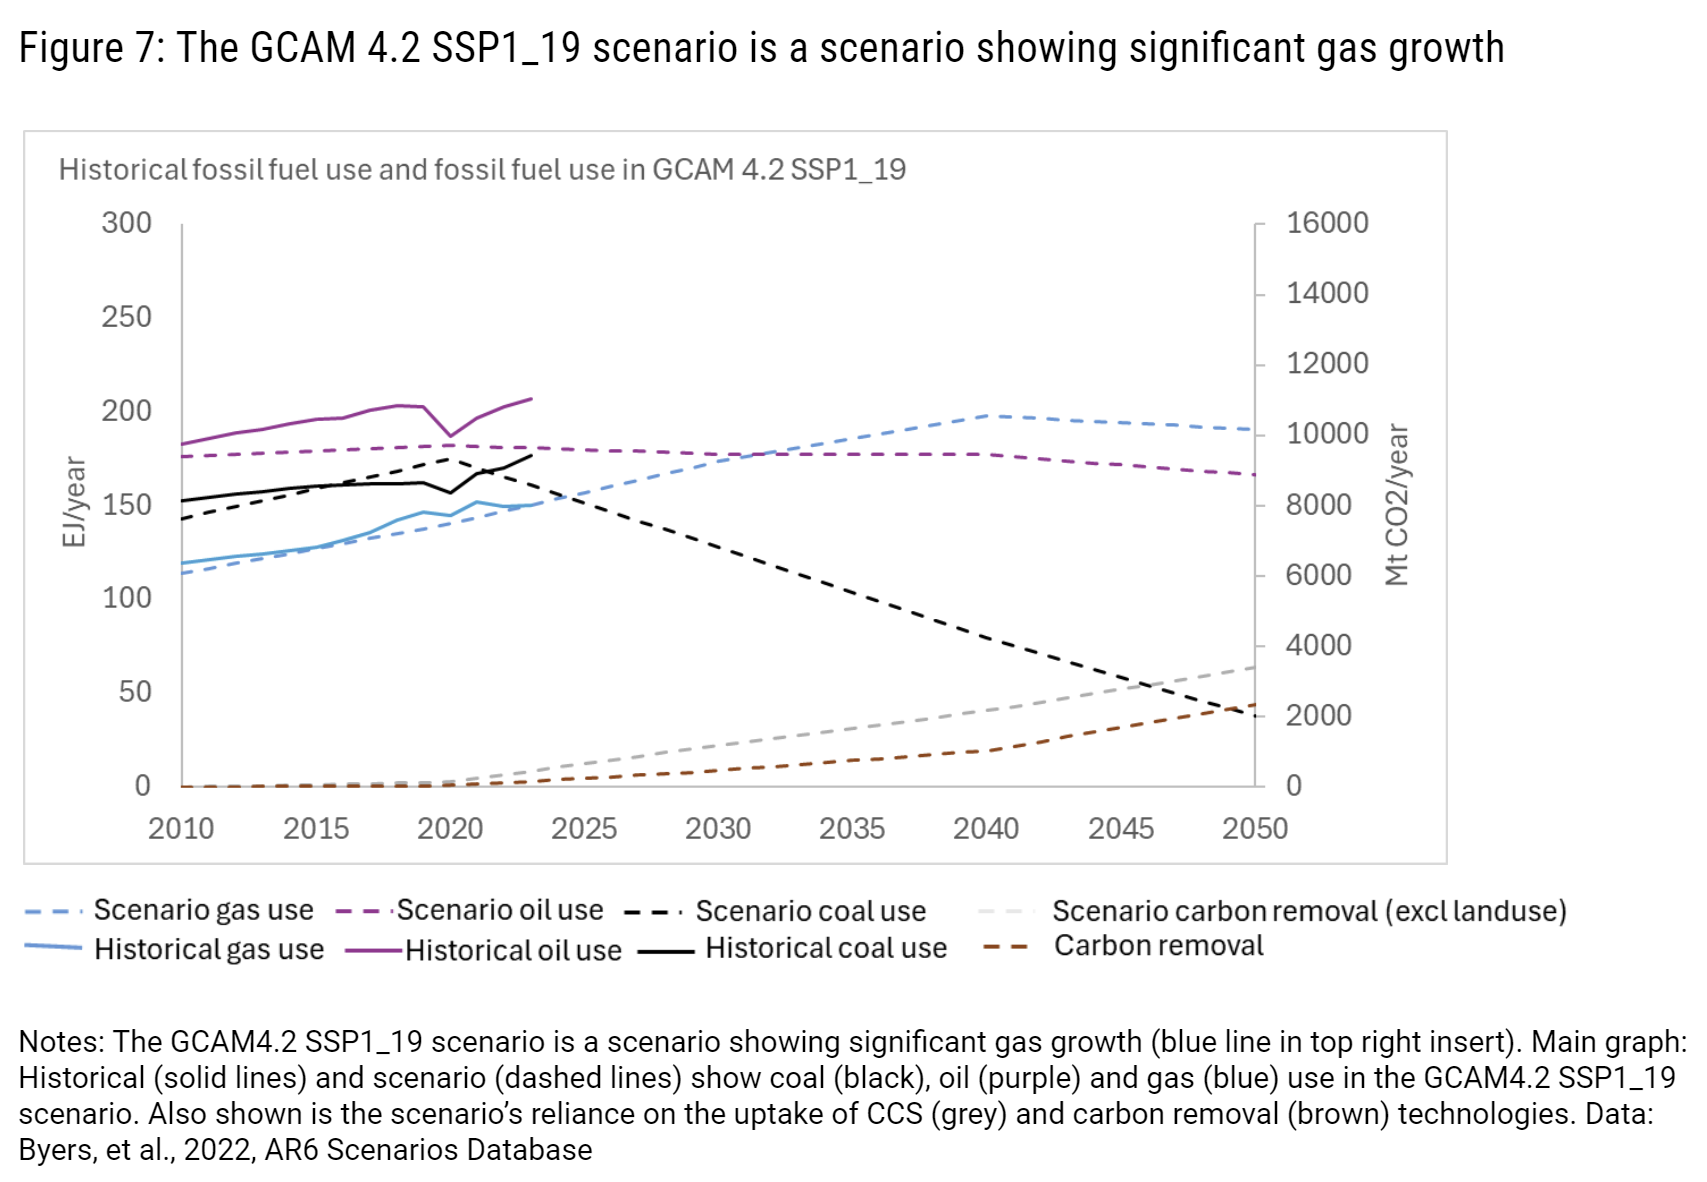
One AR6 C1 scenario that exhibits high gas demand growth is the SSP1_19 scenario that uses the GCAM4.2 model. Figure 7 shows the coal, oil and gas assumptions in this scenario. Significant gas use (in blue) can only occur due to:
The variable ‘gas use’ is therefore dependent on a lot of other variables. Each scenario is bound to a carbon budget that limits global warming to 1.5°C in 2100. If gas use is allowed to increase, it very often means that other fossil fuel needs to decline faster. If a scenario emits more than the remaining carbon budget during some period in the 21st century, enough carbon needs to be removed before 2100 to limit warming to a certain temperature.
Unsurprisingly, due to the assumed gas growth, the GCAM4.2 SSP1_19 scenario relies on very rapid uptake of CCS, including more than 1Gt in 2030, some 50 times where we are today. It also assumes half a gigatone of removals by 2030 through DAC or BECCS, which is unrealistic based on current technology. In our view, this is a vital piece of information for the investor to make an informed decision.
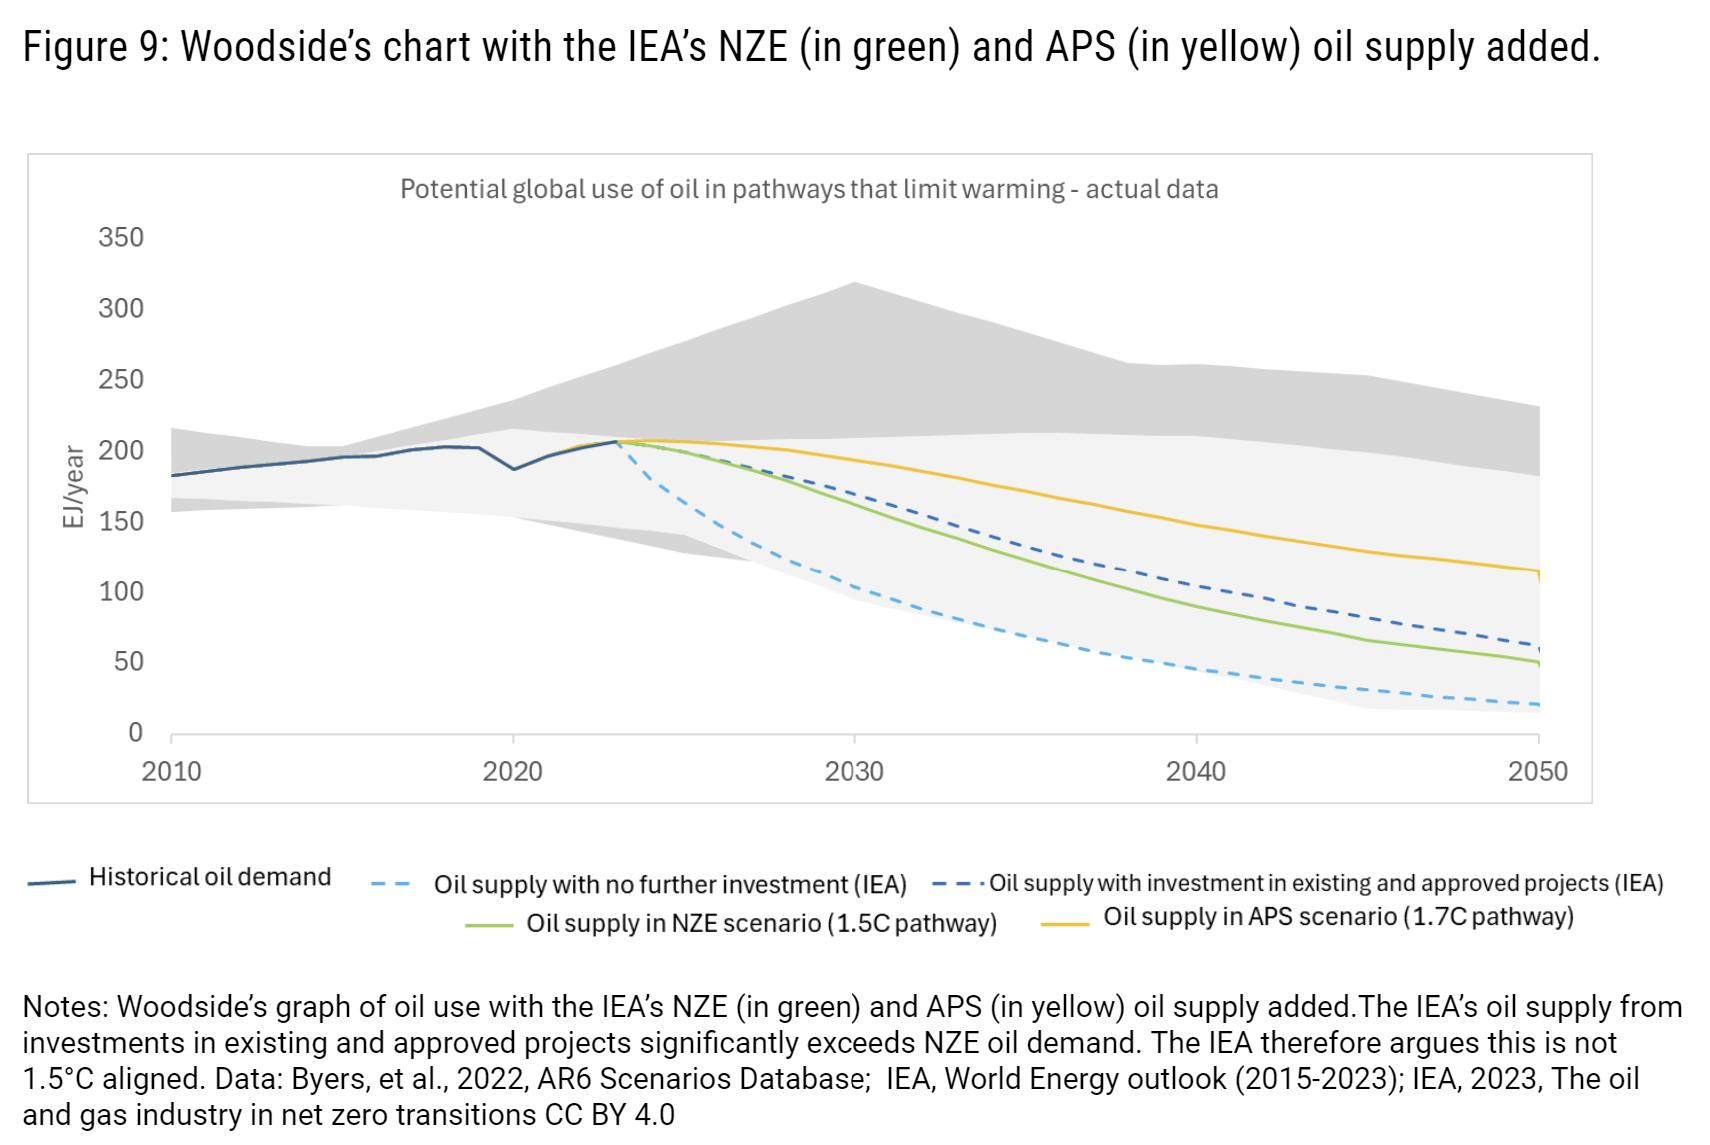
Woodside’s charts (Figures 1 and 2) also show two blue lines that represent data from the IEA World Energy Outlook 2023. Woodside states that it uses IEA data “alongside IPCC pathways in the charts”.[11] However, in ACCR’s view, plotting IEA data on top of the AR6 C1 range misrepresents what the IEA data conveys, and may lead to the incorrect perception that there is still plenty of room for new oil and gas developments in a 1.5°C scenario.
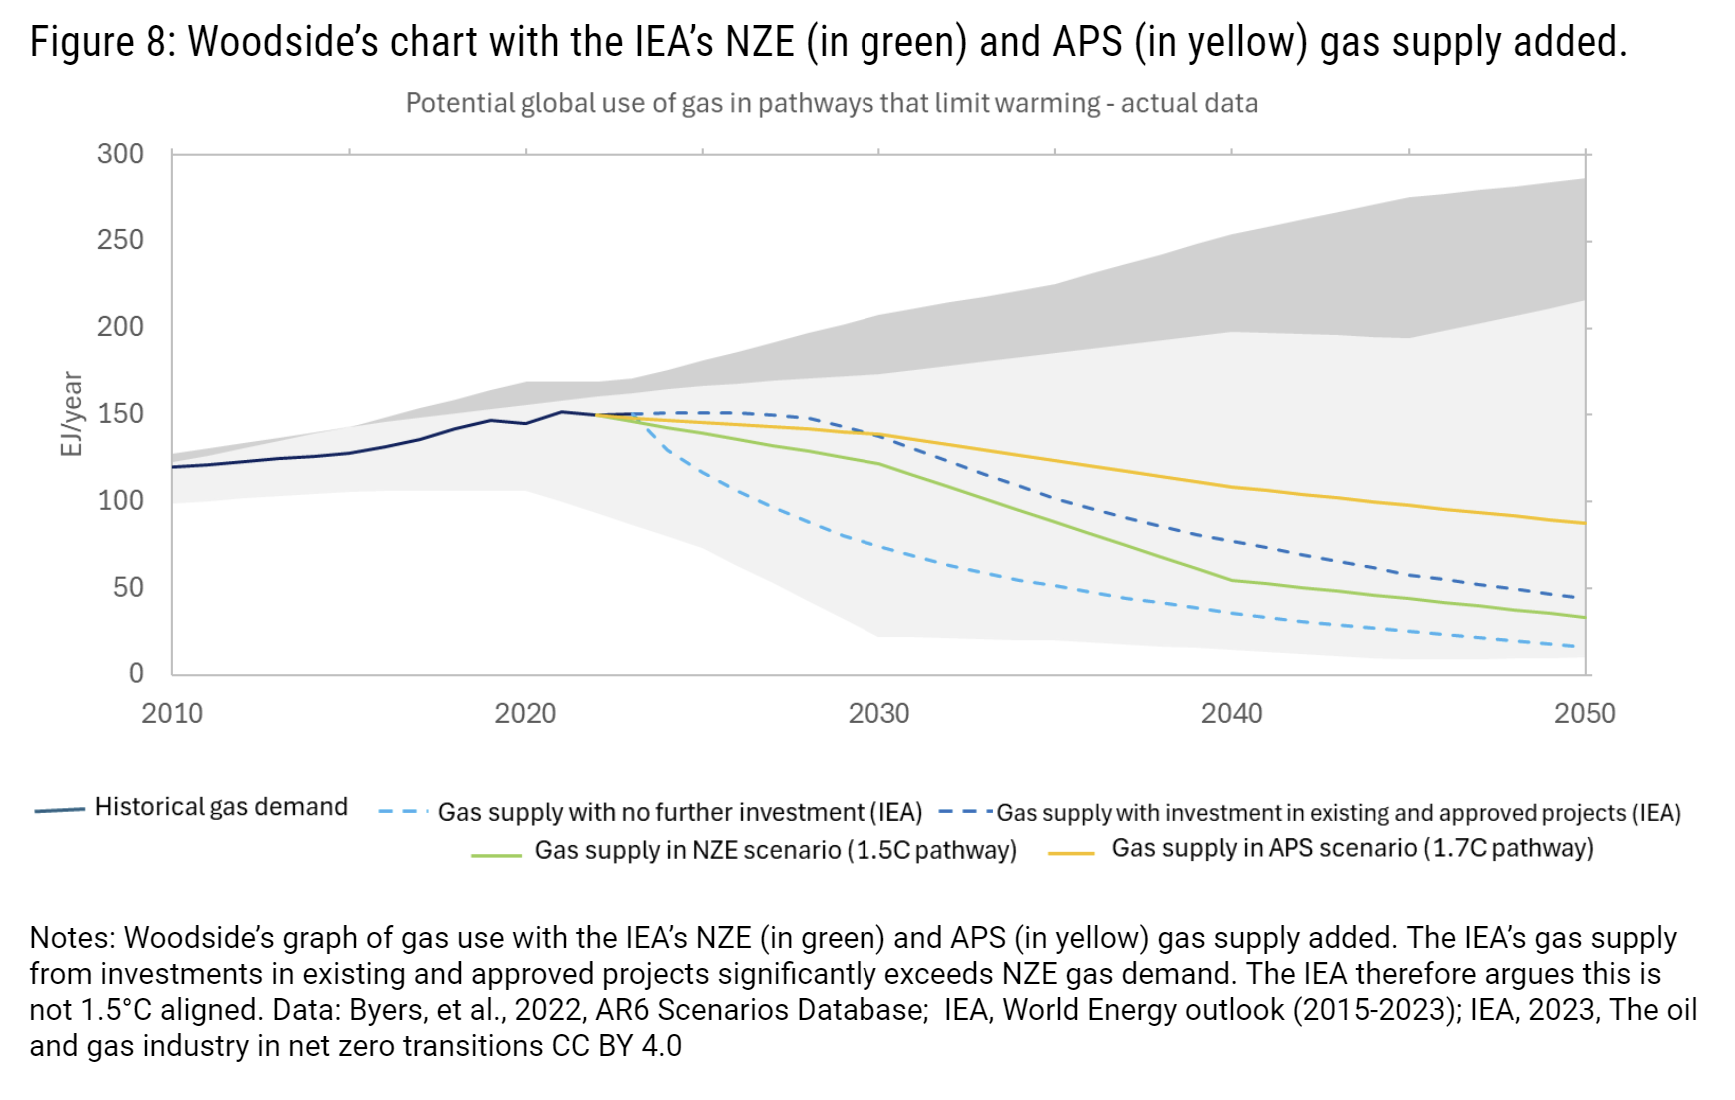
In Figures 8 and 9, ACCR has added (in green) oil and gas demand in the current IEA 2023 NZE to Woodside’s chart. This clearly shows that the total supply from investments in existing and approved projects is significantly higher than the IEA’s NZE demand. This accords with the IEA’s statements that the total investment in existing and approved oil and gas projects is not aligned with its NZE scenario.
In our view, plotting IEA data on top of the AR6 C1 range misrepresents what the IEA data conveys. Taking into account all the assumptions the IEA makes around future fossil fuel use, carbon removals, energy access and the role of forestry in emissions mitigation, not all investment in existing and approved oil and gas projects can go ahead if we are to limit warming to 1.5°C.
Plotting that portion of supply onto a graph that shows the range of oil and gas use in the AR6 IPCC 1.5°C scenarios seems to show that both data series are aligned with 1.5°C within the specific institutional scenario. Moreover, it may give rise to the idea that there is plenty of room for unapproved gas projects since the IEA’s supply from existing and approved projects data (dark blue line) appears to sit at the lower end of the C1 range.
For reference, we have also put the IEA’s Announced Pledges Scenario (APS) for oil and gas demand on these charts (yellow line). APS is aligned with a temperature outcome of 1.7°C in 2100, which is not 1.5°C aligned, nor Paris-aligned.[14] The fact the APS sits well within Woodside’s light grey range of potential pathways that limit warming to 1.5°C further highlights the flaws of the company using this methodology.
Note on scenario categorisation[15]:
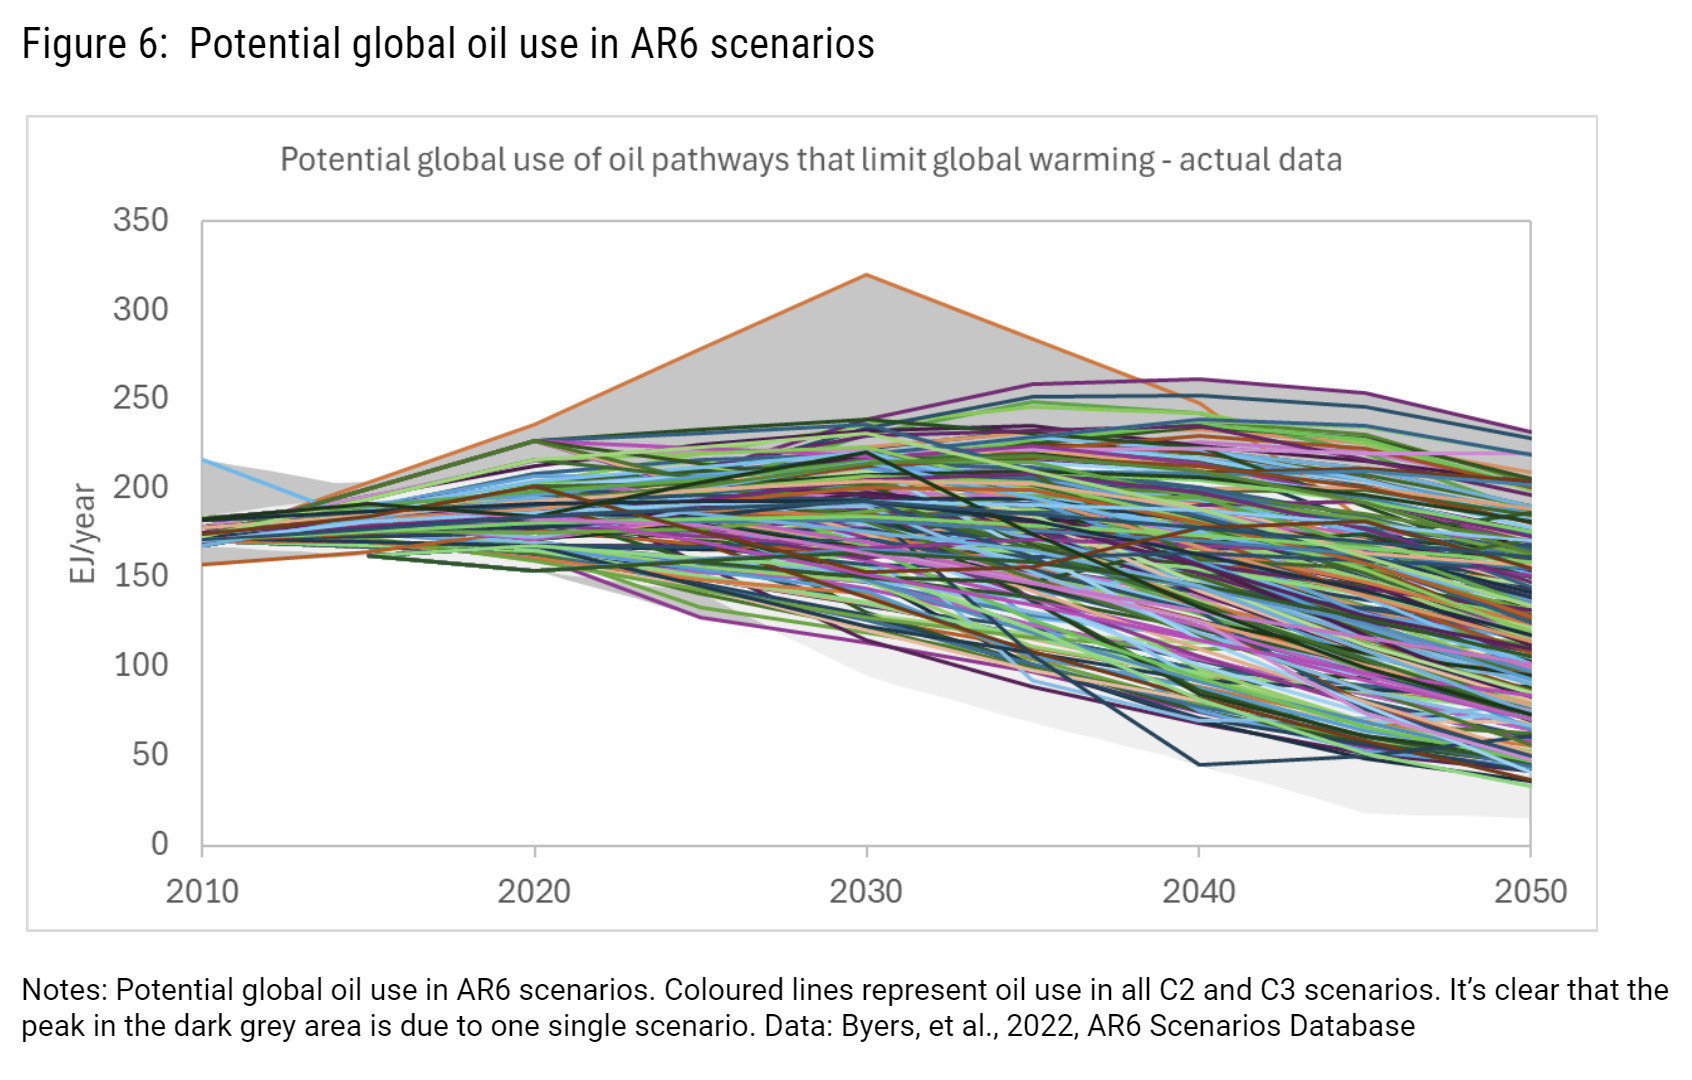
C2 and C3 scenarios are characterised by:
The restriction on how much temperature goes above 1.5°C is important. A heavy restriction provides much more certainty that warming stays well below 2°C at all times (holding to well below), which is a prerequisite of the Paris agreement. A 67% likelihood of limiting global warming to 2°C means there is a 1 in 3 chance that 2°C is breached.
Note on our reconstruction of Woodside’s charts:
The result of our reconstruction of Woodside’s charts is slightly different to Woodside’s graphs in the CTAP. The reason for that is that ACCR uses all the available data, while Woodside chooses to use data points every 10 years.
View downloadable PDF of Climate Science Insight: Woodside’s (mis)use of scenarios | 04/2024
Please read the terms and conditions attached to the use of this site.
Woodside, 2024, Thriving through the energy transition briefing transcript https://www.woodside.com/docs/default-source/asx-announcements/2024/025.-thriving-through-the-energy-transition-briefing-transcript.pdf?sfvrsn=91b6d1b9_5 ↩︎
https://www.abc.net.au/news/programs/the-business/2024-02-27/oil-and-gas-still-has-a-future-after-2050,/103519402 ↩︎
Lamboll et al., 2023, Assessing the size and uncertainty of remaining carbon budgets https://www.nature.com/articles/s41558-023-01848-5 and using 2023 emissions estimates from Friedlingstein et al., 2023, Global Carbon Budget 2023 https://essd.copernicus.org/articles/15/5301/2023/ ↩︎
See appendix for the definitions of C1 scenarios ↩︎
IPCC, 2022, Summary for Policymakers. In: Climate Change 2022: Mitigation of Climate Change, p.21, C.1.4. https://www.ipcc.ch/report/ar6/wg3/downloads/report/IPCC_AR6_WGIII_SummaryForPolicymakers.pdf ↩︎
IEA, 2023, Net zero roadmap: A global pathway to keep the 1.5C goal in reach https://www.iea.org/reports/net-zero-roadmap-a-global-pathway-to-keep-the-15-0c-goal-in-reach ↩︎
NGFS, 2023, The NGFS scenario portal https://www.ngfs.net/ngfs-scenarios-portal/ ↩︎
Woodside shows the range of gas and oil use in C1 (light grey) and C2 and C3 (dark grey). See appendix for the definitions of C1, C2 and C3. This analysis focuses on the C1 category as it features prominently in Woodside’s CTAP and contains scenarios that align with the Paris agreement goals ↩︎
Woodside, 2024, Climate Transition Action plan and 2023 progress report, p. 44 ↩︎
See appendix for the definitions of C2 and C3. ↩︎
Woodside, 2024, Climate Transition Action plan and 2023 progress report, p. 45 https://www.woodside.com/docs/default-source/investor-documents/major-reports-(static-pdfs)/ctap2023/climate-transition-action-plan-and-2023-progress-report.pdf ↩︎
IEA, 2023, Oil and gas industry in net zero transitions, p.37-39 https://iea.blob.core.windows.net/assets/f065ae5e-94ed-4fcb-8f17-8ceffde8bdd2/TheOilandGasIndustryinNetZeroTransitions.pdf ↩︎
IEA, 2023, Oil and gas industry in net zero transitions, figure 1.13 https://iea.blob.core.windows.net/assets/f065ae5e-94ed-4fcb-8f17-8ceffde8bdd2/TheOilandGasIndustryinNetZeroTransitions.pdf ↩︎
IEA, 2022, World Energy Outlook 2022, p.64. Limiting global warming to 1.7C in 2100 is not Paris aligned. https://www.iea.org/reports/world-energy-outlook-2022\ ↩︎
IPCC, 2022, Summary for Policymakers. In: Climate Change 2022: Mitigation of Climate Change, p.21, Box SPM.1 https://www.ipcc.ch/report/ar6/wg3/downloads/report/IPCC_AR6_WGIII_SummaryForPolicymakers.pdf ↩︎
Get email updates about new ACCR research and shareholder advocacy on specific topics of interest to you.
Sign Up