Over recent months, every investor will have seen the contradictions: decarbonisation pathways mapping a route to net zero as the energy transition barrels ahead, whilst oil and gas majors pursue fossil fuel expansion and generate record profits.
In this Investor Bulletin we seek to clear the air, by returning to the findings of the IEA World Energy Outlook 2022 (WEO 2022), and providing new insights for investors seeking a science and evidence-based assessment of fossil fuel demand post-2030.
The release of the IPCC synthesis report this week again highlights the immediate need for more ambitious climate action. The decarbonisation of the energy system needs to be fast-tracked. It also needs to meet the challenges laid out in the “energy trilemma”: guaranteeing energy security (affordable energy); ensuring social equity (addressing energy poverty); while driving rapid decarbonisation.
For investors looking post-2030 two key findings in the WEO 2022 stand out. The first is that despite a post-COVID recovery, this is the first WEO that shows demand for all fossil commodities peaking under all pathways, and demand for all fossil commodities peaking by 2030 under the APS and NZE pathways. Secondly, fossil fuel companies are continuing to present forecasts that are well outside the range of IEA scenarios.
What insights can investors take from this?
- There are significant implications for new project development post-2030
- Peak-gas needs to be incorporated into capital allocation discussions with companies.
In this bulletin, we undertake a deeper look at key elements of the IEA’s World Energy Outlook 2022 (IEA WEO). We analyse the regional coal and gas demand forecasts in the Announced Pledges Scenario (APS) – including the strengthened pledges that countries have put forward that will most likely increase again in order to meet the goals of the Paris Agreement.
The fossil fuel commodity markets are shrinking. In the Announced Pledges Scenario (APS) and Net Zero emissions (NZE) scenarios released in the IEA WEO, coal, oil and gas markets are shrinking before 2030. This means that any company envisaging growth of a specific fossil fuel after 2030 is assuming growth in market share. So any company pursuing new long term project developments should also be addressing the question of how they plan to grow their share in the market past 2030. If such a strategy is insufficient, or not clearly articulated, then this is potentially a red flag for future stranded asset risks.
What does the 2022 WEO say?
Key takeaways
- Despite a post-COVID recovery, this is the first World Energy Outlook that shows demand for all fossil commodities peak in all scenarios, and demand for all fossil commodities peak by 2030 for the APS and NZE scenarios.
- Emissions in both the Stated Energy Policy Scenario (STEPS) and Announced Pledges Scenario (APS) remain higher than in the Net Zero Emissions (NZE) scenario. This means we are not on track to meet the goals of the Paris Agreement (Figure 1).
- There is structurally less demand for gas and coal in the updated APS scenario, but there are significant regional differences. Browse through regional coal and gas supply/demand data for the IEA ASP scenario at the bottom of this page.
- Global emissions peak in all scenarios by or before 2025. The new STEPS scenario results in a rise of 2.5°C in global average temperatures by 2100. The new APS scenario leads to 1.7°C by 2100, which is closer to, but does not achieve, the ‘well below 2°C’ goal of the Paris agreement.
- Nonetheless, emissions projections have reduced in both the STEPS and APS. This suggests that the ‘pledge and review’ process of the Paris Agreement is having a positive impact and future scenarios should show lower fossil fuel demand (Figure 1).
- The ambition of the APS has increased so significantly that the Sustainable Development Scenario (SDS) has been retired.
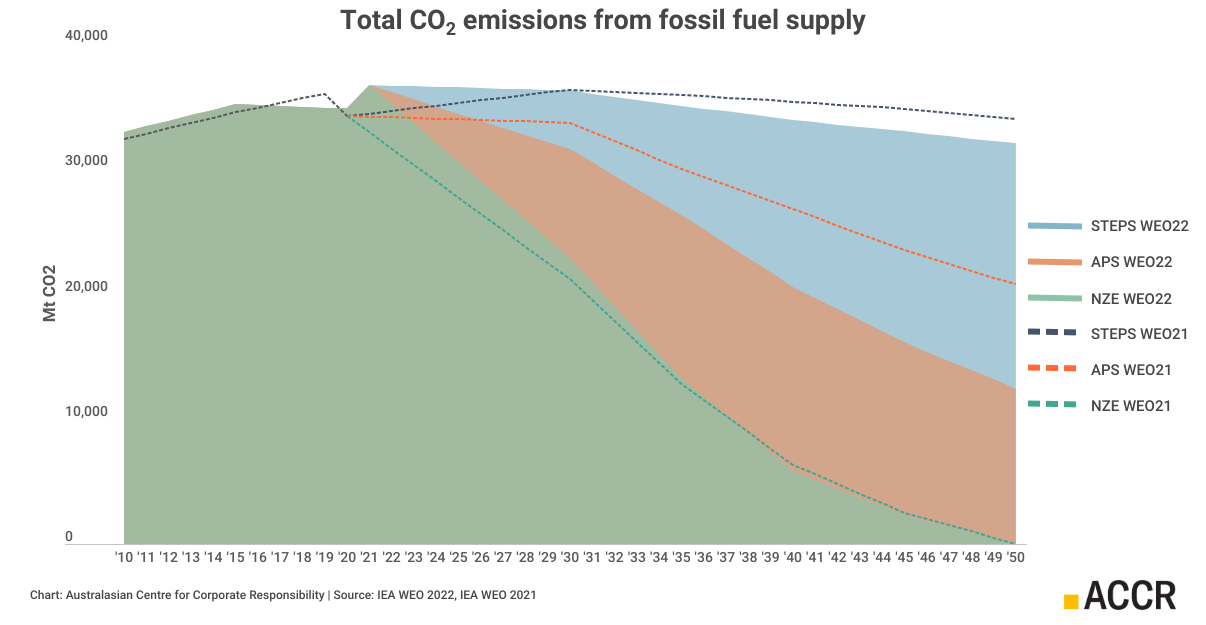
Figure 1: Total CO2 emission from fossil fuel supply for IEA’s STEPS, APS and NZE scenarios, released in 2021 (dashed lines) and updated in WEO2022 (areas). The WEO2022 takes into account the post-Covid rebound and the impact of the Russian invasion.
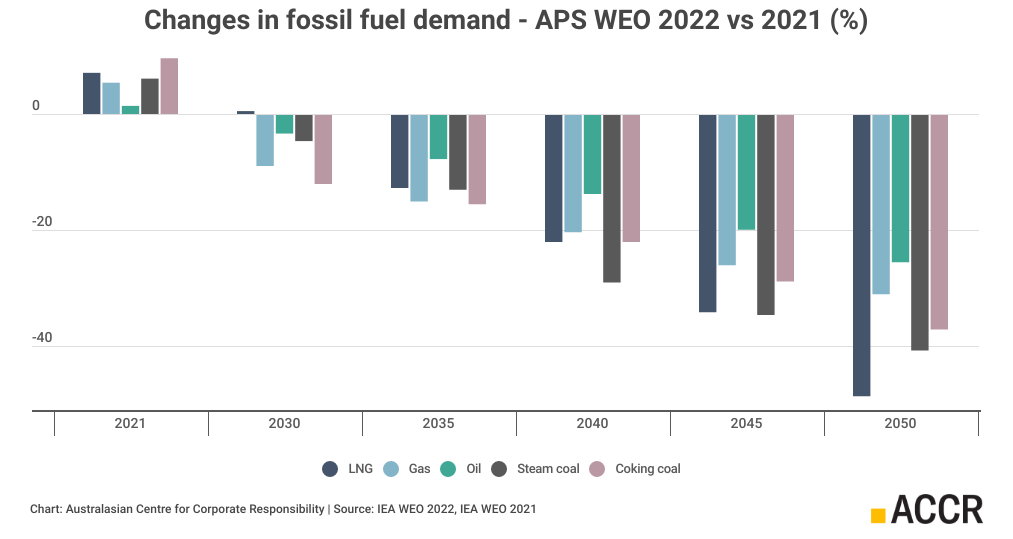
Figure 2: Changes in fossil fuel demand for the WEO2022 Announced Pledges scenario (APS) compared with the APS in the World Energy Outlook 2021 (WEO2021). Updated demand forecasts for gas, oil, steam coal and coking coal are down across all time periods, while LNG sees a 0.5% higher demand in 2030 compared to WEO2021.
Commodity insights and regional demand outlook update for significant markets
- In the 2022 APS, demand for all fossil commodities has decreased relative to the 2021 APS (Figure 2).
- For the APS, LNG is the only commodity that hasn’t seen demand destruction to 2030 relative to the WEO 2021. Beyond 2030, however, LNG demand falls faster than for other commodities, with a more than 48% reduction in 2050 (figure 2). This cannot justify all the new gas development proposed by the oil majors.
The role of the Russian invasion into the Ukraine
- Ukraine has been a dramatic shock to energy markets, but the IEA is crystal clear that “this is a crisis where energy transitions are the solution, rather than the problem”.
- The net impacts of these supply disruptions have been increased investment in low cost and local energy production – that is, more renewables and less fossil fuels.
- Gas demand in all three scenarios has decreased by more than what Russia exports. So, today’s high prices and unprecedented profits are leading to sustained demand destruction – even for producers outside of Russia (Figure 3).
Observations from the 2022 APS
Both the updated regional coal and regional gas demand forecasts show significant changes.
Coal demand:
- Short and long term forecasts are lower for all significant markets in the WEO 2022 compared to WEO 2021, except the EU market. In China - the largest market, with a 56% share -the accelerated decline is more than 15% by 2040 compared to WEO 2021. The US (-30% by 2035), Indian (-20% in 2035) and other Asian markets also have significantly lower demand forecasts compared to last year.
- India is the only region in which the WEO sees coal demand growing (15% towards 2030), before declining after 2030.
- Overall, long term forecasted steam coal prices have decreased in the new WEO as demand declines are sharper compared to WEO 2021 (more than 10%, 7% and 4% in 2040 for the EU, China and Japan respectively), although the US and China see higher prices in 2030. This will have an impact on greenfield and expansion thermal coal projects that use IEA WEO 2021 as their reference.
Gas demand:
- In the APS, as stated in the WEO 2022, the decline in gas demand means that only projects currently under construction are required.
- Short and long term forecasts are declining faster for all significant markets in the WEO 2022 compared to WEO 2021, except North America where demand is also declining, but slightly less rapidly. By 2035, the additional decline is greater than 10% in all markets other than the North American market.
- Gas demand grows in Asia, Africa and the Middle East towards 2030, but significantly slower compared to WEO 2021, with demand growth in China (6%), the Middle East (13%) and Africa (10%). The only gas demand growth beyond 2030 comes from India (93% towards 2040 on 2021 baseline) and Southeast Asia (23% towards 2035 on 2021 baseline).
- Despite gas demand decreasing – and this being enough to offset Ukraine impacts before 2030 – long term gas price forecasts have increased in Japan and the US, and gas prices are higher across the board in 2030 compared to WEO 2021.
Scenario reliance on CCS
- CCS demand has decreased relative to WEO 2021, particularly in the NZE. The uptake of CCS towards 2030 is slow, but it does play a significant role in the APS and NZE towards 2050 (21% and 72%), when coal and gas demand are much lower than today. The role of CCS in coal has not changed significantly, but in NZE CCS demand in gas is much lower (-40%).
Companies using well out-of-range demand forecasts
Despite the continual decrease in unabated fossil fuel demand, and the Paris Agreement being designed to make sure this continues, fossil fuel companies are continuing to present forecasts that are well outside the range of IEA scenarios.
Two scenarios presented regularly in oil and gas transition plans are:
- Wood Mackenzie’s Energy Transition Outlook scenario (ETO), referred to as a ~3°C scenario.
- Accelerated Energy Transition scenario (AET), referred to as a 2°C scenario.
Currently, both the ETO and AET scenarios have not been corrected for the Russian invasion and are arguably now out of date. Under the ETO scenarios, the outlook for LNG is significantly higher than STEPS, APS and NZE. The AET relies on significant CCS uptake after 2030.
The ETO scenario that was shown in the 2022 Santos investor presentation aligns with the AET by the year 2040, but has been adjusted for higher demand prior to 2040. This nullifies the “success” of reaching the target in 2040, because of the increase in additional cumulative emissions prior to 2040. It will also require much more CCS in that period to comply with a 2°C scenario (Figure 4).
Concluding remarks:
The WEO2022 and the additional analysis shown here show that:
- Despite the Russian invasion into the Ukraine, demand across all fossil fuels declines well before 2030 in the updated NZE and APS scenarios.
- LNG demand sees some growth towards 2030 in APS, declines thereafter and declines most of all fossil fuels by 2050, which cannot justify all the new gas development proposed by the oil majors.
Investors looking post-2030 should be considering:
- What the implications are for new project development post-2030 and;
- Why peak-gas needs to be incorporated into capital allocation discussions with companies.
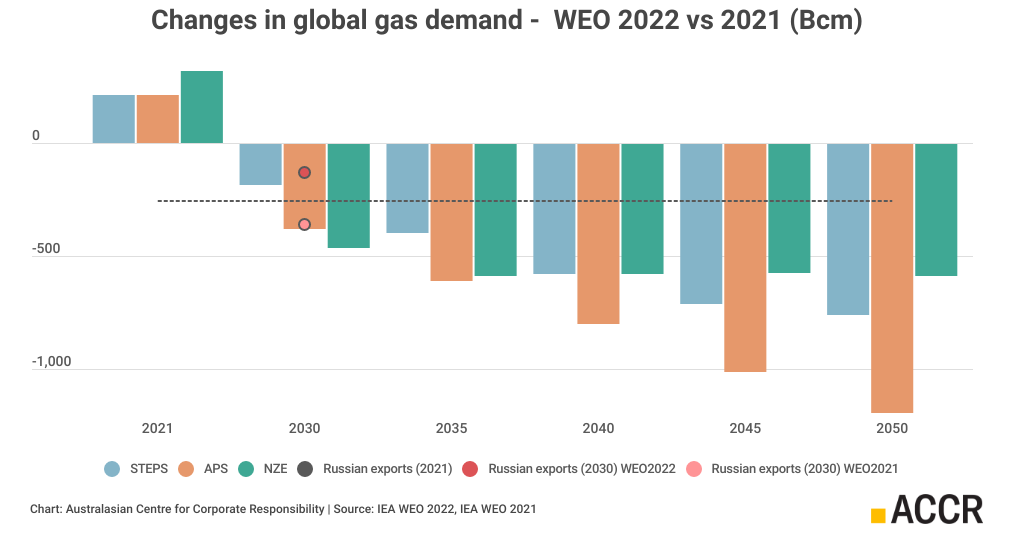
Figure 3: The change in global gas demand in the APS is larger than Russia’s 2021 gas exports (horizontal dashed grey line). The IEA also updated its forecast of Russian exports in 2030, which are forecasted to be smaller than Russia’s 2021 exports (dark red dot: updated 2030 forecast, light red dot: WEO 2021 2030 forecast) .

Figure 4: Total global LNG demand in IEA’s STEPS, APS and NZE scenarios compared to Wood Mackenzie’s ETO and AET-2 scenarios and a scenario reaching AET-2 demand in 2040 but resulting in much higher cumulative demand and emissions. It is unclear why Wood Mackenzie demand scenarios have higher actual data for recent years.
Coal demand in the Announced Pledges Scenario (APS, IEA WEO 2022)
Coal demand under the Announced Pledges Scenario (APS) in the IEA World Energy Outlook 2022, as total energy supplied (EJ) within a certain region. The red circle indicates the regional market share of global demand. Clicking on the circle will show the percentage share. Clicking on the marker will show a plot of the forecasted demand and the difference between WEO2021 and WEO2022. Map: Australasian Centre for Corporate Responsibility. Data source: International Energy Agency (2022), World Energy Outlook 2022, IEA, . Licence: Creative Commons Attribution CC BY-NC-SA 4.0
Gas demand in the Announced Pledges Scenario (APS, IEA WEO 2022)
Gas demand under the Announced Pledges Scenario (APS) in the IEA World Energy Outlook 2022, as total energy supplied (EJ) within a certain region. The red circle indicates the regional market share of global demand. Clicking on the circle will show the percentage share. Clicking on the marker will show a plot of the forecasted demand and the difference between WEO2021 and WEO2022. Map: Australasian Centre for Corporate Responsibility. Data source: International Energy Agency (2022), World Energy Outlook 2022, IEA, . Licence: Creative Commons Attribution CC BY-NC-SA 4.0