15th February 2022
Publication Information
Download Publication
- 1 MB PDF
- 15th February 2022
Stay Informed
Get email updates about new ACCR research and shareholder advocacy on specific topics of interest to you.
Sign UpFor decades, the Australian liquefied natural gas (LNG) industry has claimed[1] that gas is clean, affordable, and compatible with global decarbonisation goals due to its displacement of coal use in Asian economies. Despite a lack of data and analysis to support these claims, their impact has been far-reaching, with politicians, analysts[2] and media[3] repeating them verbatim.
“We're absolutely committed to continuing to support the energy and emissions-reduction needs of our region through our role as a global LNG exporter”
Angus Taylor, Minister for Industry, Energy and Emissions Reduction, August 2021[4]
This paper reviews several of the Australian LNG industry’s claims and finds they are inaccurate or exaggerated. The evidence instead suggests:
Australian LNG operators nominally voice support for the Paris Agreement (or at least the Paris Agreement’s aspirations or objectives), but in fact, are investing for a world where the Paris Agreement’s objectives are not met. With the support of many shareholders, they are making multi-billion-dollar bets that the world will not manage to decarbonise at a rate that gives us a chance of a safe climate.
This report is intended to rebut the LNG industry’s claims with reputable data, analysis, and insights. We encourage institutional investors that support the Paris Agreement to draw on this paper in their engagement with companies in their portfolios. Investors have a range of options available to them, including to:
ACCR recognises that investors in LNG companies are enjoying improving returns due to the current gas crisis. However, it is important to not conflate this short-term financial benefit with positive climate outcomes. An investment in gas is not an investment in the Paris Agreement.
The Australasian Centre for Corporate Responsibility (ACCR) has been engaging with ASX-listed liquefied natural gas (LNG) producers on their climate change impacts and commitments over the last 10 years. Throughout this time, the industry has repeated a handful of key claims regarding the climate benefits of its product. These claims have been echoed by a wide range of stakeholders across politics, the investment sector, and the media. Industry claims that:
When ACCR has sought clarification from LNG producers to substantiate these claims, the response has often been underwhelming. In some instances, producers have commissioned research[5] to support aspects of their claims, however, the framing of that research is prone to bias.
This paper is an attempt to examine the evidence available to support the industry’s claims. For each claim, a summary of example quotes from industry has been provided, along with ACCR’s analysis of current, reputable data on the subject.
This report is intended to arm institutional investors with quality data and insights to inform their engagement with their portfolio companies.
Before examining Australian LNG producers’ claims regarding the attributes of their product, it is useful to consider the more general messaging from the industry and its lobbyists regarding climate action, and in particular the Paris Agreement. Most major Australian oil and gas companies, along with their industry association, the Australian Petroleum Production and Exploration Association (APPEA), claim to be supportive of the Paris Agreement. For example:
With these supportive statements for the Paris Agreement, investors and other stakeholders could be easily convinced that the Australian LNG industry is contributing to a global decarbonisation path in keeping with the goals of the Paris Agreement. However, several of the industry’s often-repeated claims about gas’ compatibility with the Paris Agreement do not stand up to scrutiny.
Within this section, we provide important contextual information about Australia’s LNG industry, including our key customer countries, how these countries are using LNG and country-level decarbonisation commitments.
Australia has ten LNG export terminals with combined nameplate capacity of 88 million tonnes per annum[10]. In 2020, Australia exported 77.8 million tonnes of LNG valued at $36 billion[11], more than any other country[12]. Figure 1 shows that Australia’s LNG exports have grown three-fold since 2014-15[13]. Much of this growth in production was from over 40 million tonnes per annum (Mtpa) of projects that were sanctioned between 2010 – 2012[14]. The only sanctioned project that will provide additional processing capacity since then has been Woodside’s Pluto 2 project, which achieved final investment decision in November 2021.
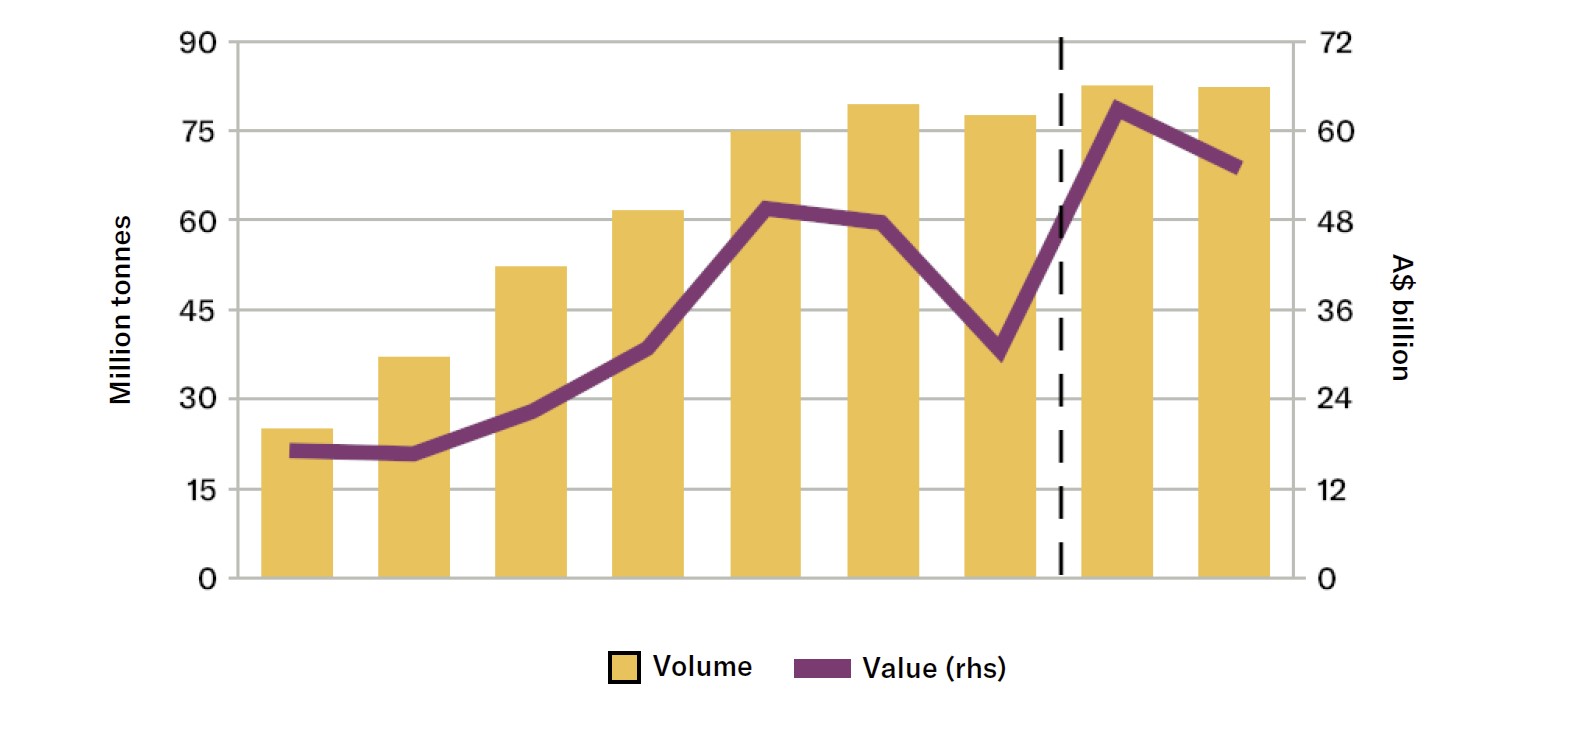
Figure 1: Recent growth of Australia’s LNG production | Australian Office of the Chief Economist
New fields intended to supply Pluto 2, backfill LNG facilities or provide domestic gas have also been sanctioned, such as Woodside’s Scarborough and Santos’ Barossa projects. These are intended to come online as Australia may see the first LNG trains decommissioned, with Woodside having announced that LNG trains at the North West Shelf may start being decommissioned from 2024[15].
Additional gas resources are being pursued in increasingly marginal locations, including the Beetaloo Basin (NT), the North Bowen (QLD), Galilee Basin (QLD), the Cooper Basin (SA), the Adavale Basin (QLD)[16], and the Canning Basin (WA).[17] As recognised in the APPEA-commissioned Wood Mackenzie 2020 Oil and Gas Outlook, the future of Australia’s oil and gas industry depends on developing “currently uneconomic or stranded discovered gas resources” in order to extend “the economic life and utility of existing gas and LNG infrastructure”[18].
With the expansion of LNG exports, the industry’s influence has also grown. Since 2020, the gas industry has benefited from explicit Federal government support under the domestic gas-focused “gas-fired recovery”[19]. After assessing the merits of a gas-fired recovery, the Grattan Institute concluded that “far from fuelling the recovery from the COVID recession, natural gas will inevitably decline as an energy source for industry and homes in Australia”[20].
LNG is a global commodity, with import terminals located in 43 countries[21]. Australian LNG is preferentially shipped to Asia, with about 90% imported by Japan, Korea, China, and Taiwan[22] in 2020. Figure 2 compares the destination countries of the global LNG market to that of Australian LNG exports.
Figure 2: Global distribution of 2020 LNG importers (%) | BloombergNEF
Whilst comprising only one per cent of Australian exports, India has been touted as a growth market for Australian LNG since projections show growth in Indian gas use [23]. This would require Australian LNG producers to outcompete Qatar: a geographically advantaged, lower-cost supplier with plentiful production and established business relationships. Qatar already supplies over half of Indian LNG[24] and recently announced the largest ever final investment decision for an LNG development[25]. Qatar’s North Field has a cost of supply of $4/MMBtu, well below Australia’s latest LNG project (see: Section 7, How affordable is Australian LNG?). India is also aiming to increase energy independence[26], which suggests future policy efforts will aim to slow LNG growth.
Many claims regarding gas’ role in reducing emissions centre on the electricity sector. In the markets that import Australian LNG, gas (including LNG) is used in the power, industry, residential and commercial sectors. China also uses a considerable amount of gas in its transport sector. Figure 3 shows the 2020 sectoral split for gas use in these destination countries.
Figure 3: Gas uses in key Australian LNG markets (bcm) and implied use mix of Australian LNG exports (%) | BloombergNEF
When weighted by their 2020 share of Australian LNG exports to Japan, South Korea, China, and India, 30% of Australian LNG is used in the electricity sector, 37% in industry and 24% goes to residential and commercial customers[27]. As discussed below, coal use is concentrated in the power and steel sectors. Since natural gas does not appear to have a growing role in steel[28], this limits the discussion of coal-to-gas displacement to the power sector.
Australia’s major fossil fuel export partners have all committed to rapidly reducing carbon emissions and fossil fuel use. Japan[29], Korea and Taiwan[30] are all targeting net zero emissions by 2050, with China targeting net zero by 2060[31].
Japan also aims to reduce its emissions by 46% by 2030, based on a 2013 baseline. A key enabler of this 2030 target is Japan’s Strategic Energy Plan[32]. This plan includes specific targets for Japan’s 2030 electricity mix such as:
Rather than displace coal with gas, Japan has committed to reducing both gas and coal-fired electricity and replacing them with renewables. In fact, it plans to reduce gas power faster than it reduces coal power. The absolute impact on Japanese gas-fired electricity is a reduction of 207 TWh by 2030. This is equivalent to 53% of 2019 gas-fired generation, or 30% of Japan’s 2020 LNG imports[33].
South Korea has a target to reduce emissions by 40% by 2030 and achieve net zero emissions by 2050[34]. This includes government support to increase renewable capacity from 12.7 GW in 2019 to 42.7 GW in 2025[35]. There is no commitment to increase gas use, again suggesting that renewables will replace both gas and coal generation. South Korea recently issued a green taxonomy to provide definitions for funding of green projects technologies[36]. This does include LNG power, but only for a temporary period (8-13 years) and only where generators meet a stringent efficiency requirement[37].
China “aims to have CO2 emissions peak before 2030 and achieve carbon neutrality before 2060; to lower CO2 emissions per unit of GDP by over 65% from the 2005 level, to increase the share of non-fossil fuels in primary energy consumption to around 25%, to increase the forest stock volume by 6 billion cubic meters from the 2005 level, and to bring its total installed capacity of wind and solar power to over 1.2 billion kilowatts by 2030.”[38] As with Japan and South Korea, China’s NDC does not suggest any aspiration to increase gas use.
Importantly, Japan, Korea and China’s targets and policies are not consistent with limiting warming to 1.5 or less than 2 degrees[39], meaning there is a possibility that these targets will be strengthened in accordance with the 5-year Nationally Determined Contribution reviews required by the Paris Agreement[40]. Additionally, whilst there is some scepticism[41] about the capacity of these countries to meet their decarbonisation targets, which could lead to an increased or prolonged role for natural gas, it is important to not conflate the benefits this may bring to LNG investor returns with positive outcomes for the climate. As we demonstrate in The role of IEA scenarios in industry messaging, scenarios that project a larger uptake of gas are at odds with the Paris Agreement.
This section presents the claims made by the Australian oil and gas industry regarding gas being clean and analyses the available data on the subject. Claims about the greenhouse benefits of burning gas have a direct relationship with claims relating to coal to gas displacement in electricity generation, which is explored in section 5.
When considering the emissions of various energy sources, the first point to make is that unlike gas and coal, renewable energy such as solar and wind power has no direct emissions. It is the cleanest source of electricity generation.
Noting that, it is next worth understanding how gas is used to generate electricity. A gas turbine mixes natural gas with compressed air and then combusts it. The combustion expands the gas mixture before it passes through a turbine which spins an electricity generator. When this turbine-spun generator is the only source of electricity, the system is called an open-cycle gas turbine (OCGT, sometimes referred to as simple-cycle) and much of the energy in the combusted gas is lost as heat in the exhaust gas stream. Combined-cycle gas turbines (CCGT) differ from OCGT as they capture some of the energy in the exhaust to generate steam, which can then be expanded through another turbine-generator[46].
Typical thermodynamic efficiencies of modern OCGTs are 30-40%, whilst CCGTs range from 50-65%[47]. Real world data for Australia’s National Electricity Market (NEM) is presented in Figure 4, demonstrating that CCGTs have 41% lower emissions than coal, but OCGTs are only 24% lower[48]; neither reaching the 50% reduction often quoted by the gas industry.[49] The role of OCGT for the provision of firming power is covered below in Batteries are winning the firming cost battle.
Figure 4: Average Scope 1 emissions intensity of selected electricity sources for 2021 in Australia’s NEM (tCO2-e/MWh)
Australia has a particularly old coal fleet whereas many coal power stations in Asia are newer super-critical, or occasionally ultra-super-critical generators, which operate more efficiently since they generate higher pressure and temperature steam.[50] Figure 5 shows the results of a lifecycle assessment comparing greenhouse intensities (tCO2-e/MWh) of coal, conventional LNG and coal seam gas-based LNG, illustrating how in some cases gas generators can be more emissions-intensive than coal generators[51]. For example, the most efficient ultra-super-critical coal generation in this study emitted 0.58 tCO2-e/MWh on a lifecycle basis, which is more efficient than the 0.71tCO2-e/MWh average intensity for an open cycle gas turbine fed with conventional LNG.
The higher efficiency of a CCGT reduces fuel costs which is why most gas generation today uses CCGT technology, including about 75% of the gas generation in the NEM[52], and all the gas generators in China’s grid[53]. The added complexity of the steam cycle makes CCGTs less flexible, and therefore less useful as increasingly valuable firming power. Grids will require greater flexibility as their share of variable renewable energy increases, and OCGTs are one of several technologies that can increase flexibility (discussed further below). Many energy modelling scenarios therefore show gas generation investment shifting towards OCGTs.[54]
Arguing that gas is a low emissions source of electricity ignores the fact that lower emissions (and cheaper) forms of electricity exist and that the emerging uses for gas have smaller emission advantages.
Figure 5: Lifecycle emissions for coal and LNG based electricity; average and range where available (tCO2-e/MWh)
One example of large scale OCGT use is in LNG facilities themselves. Gorgon[55], Wheatstone[56], APLNG[57], GLNG[58], QCG[59], NWS[60], Pluto[61] and DLNG[62] all generate on-site power using OCGTs. The only Australian exceptions are Ichthys LNG[63], which uses CCGT and Prelude that uses even less efficient steam turbines[64]. It is contradictory that whilst the LNG industry claims a key benefit of natural gas is having lower emissions in power generation, they use gas less efficiently than most of their customers.
Although there is limited scope for coal-to-gas switching in the residential sector, Santos has recently claimed that its gas, which is “replacing higher-emitting coal in household heating and cooking,” presents the greatest impact the company can have in reducing global emissions[65].
Imported gas consumption in Asia’s ‘domestic and commercial’ markets relies on Australian gas being extracted, liquefied, shipped, regasified, transmitted and distributed, before being combusted by a consumer. The quantity of fugitive emissions associated with each stage is heavily contested. Carbon Brief, for example, compiled estimates ranging from 0.6% through to 9% of total gas extracted for the production stage of US shale gas[66]. To put this into context, several studies suggest that fugitive emissions above 3% of gas extracted mean that gas is more emissions-intensive than coal[67].
Australian emissions reporting rules assume much lower levels of production fugitive emissions, although this is contested, particularly for coal seam methane fugitive emissions.[68] In contrast, the fugitive emission factors for gas distribution networks vary hugely. Under Australian reporting rules between 0.2% and 4.9% of gas that enters gas distribution systems is deemed to be ‘unaccounted for gas’[69], with 55% of this ‘unaccounted for gas’ considered to be fugitive emissions.
Quantifying the climate impact of fugitives is complicated by the fact that methane is a more potent greenhouse gas that decays more rapidly than carbon dioxide. The typical approach to incorporating these competing factors is with a global warming potential (GWP), which represents the average impact of a gas relative to carbon dioxide over a given period. Australian and UN accounting rules use a 100-year period, or a GWP of 28 tCO2-e/tCH4. Given the urgency of responding to climate change many groups advocate for the use of a 20-year GWP, or 84 tCO2-e/tCH4. The analysis in Figure 6 applies both values.
When comparing the range of emissions intensities of gas using Australian data as a proxy for Asian distribution systems, the emissions advantages of LNG over coal are greatly reduced. Instead of the ‘about 50%’ reduction often quoted for electricity generation[70], gas would only have 5 - 29% lower emissions than combusting coal if it was transported through a gas distribution system with fugitive emissions comparable to South Australia’s[71]. Many domestic and commercial gas uses can also be substituted with electricity, opening the alternative to use renewable electricity, therefore avoiding all combustion emissions for domestic applications of natural gas.
Figure 6: Impact of fugitives on distributed gas emissions intensity (tCO2-e/GJ) | ACCR analysis
In this section we explore the most persistent industry claim, being that Australian LNG has and will displace coal consumption in the economies of our customer countries.
The consistency of this messaging from Australia’s LNG producers, industry consultants and their lobbyists has influenced key decision-makers, with the Federal Government frequently reiterating this view. In 2018, the Department of Industry, Science, Energy and Resources released a quarterly national greenhouse inventory with a preamble that included this statement: “Australia's total LNG exports are estimated to have the potential to lower emissions in importing countries by around 148 Mt CO2-e in 2018 if they displace coal consumption in those countries”[77]. In August 2021, Minister for Energy and Emissions Reduction, Angus Taylor, advised the Bank of America Japan Conference that Australia is “absolutely committed to continuing to support the energy and emissions-reduction needs of our region through our role as a global LNG exporter”[78].
Investment analysts often support this view, stating that LNG is essential for coal displacement in Asia and that it will be the “fastest growing hydrocarbon over the next decade”[79]. The message is also frequently reiterated in the financial press. The Australian Financial Review recently celebrated Woodside’s final investment decision for the Scarborough project, stating that “new gas reserves are still needed to see the global economy through a long transition period and to fill in the waning use of much dirtier coal”[80].
One example that the LNG industry quotes is the IEA’s ‘Role of Gas Report’, which says that over 500 MtCO2-e has been avoided by coal-to-gas switching between 2011 and 2018[81]. This sounds like a large number but is immaterial when compared to total gas emissions. The reduction equates to 75 MtCO2-e per year, which is about 1% of the 7 GtCO2-e that was emitted by gas combustion in 2020[82]. This means that for every tonne of emissions that gas saved from 2011 to 2018, an additional 99 tonnes were emitted elsewhere.
When looking at the opportunities for coal-to-gas displacement, it’s worth considering the role of coal and gas in the energy system. Figure 7[83] shows a Sankey diagram of the global energy flows relating to coal, gas, and electricity. Globally, three quarters of coal and half of gas is used in electricity generation (including associated losses). Nearly all the remaining coal is used in the industrial sector, with large portions of this used to make steel and process non-ferrous minerals. Other sectors account for less than 5% of global coal use.
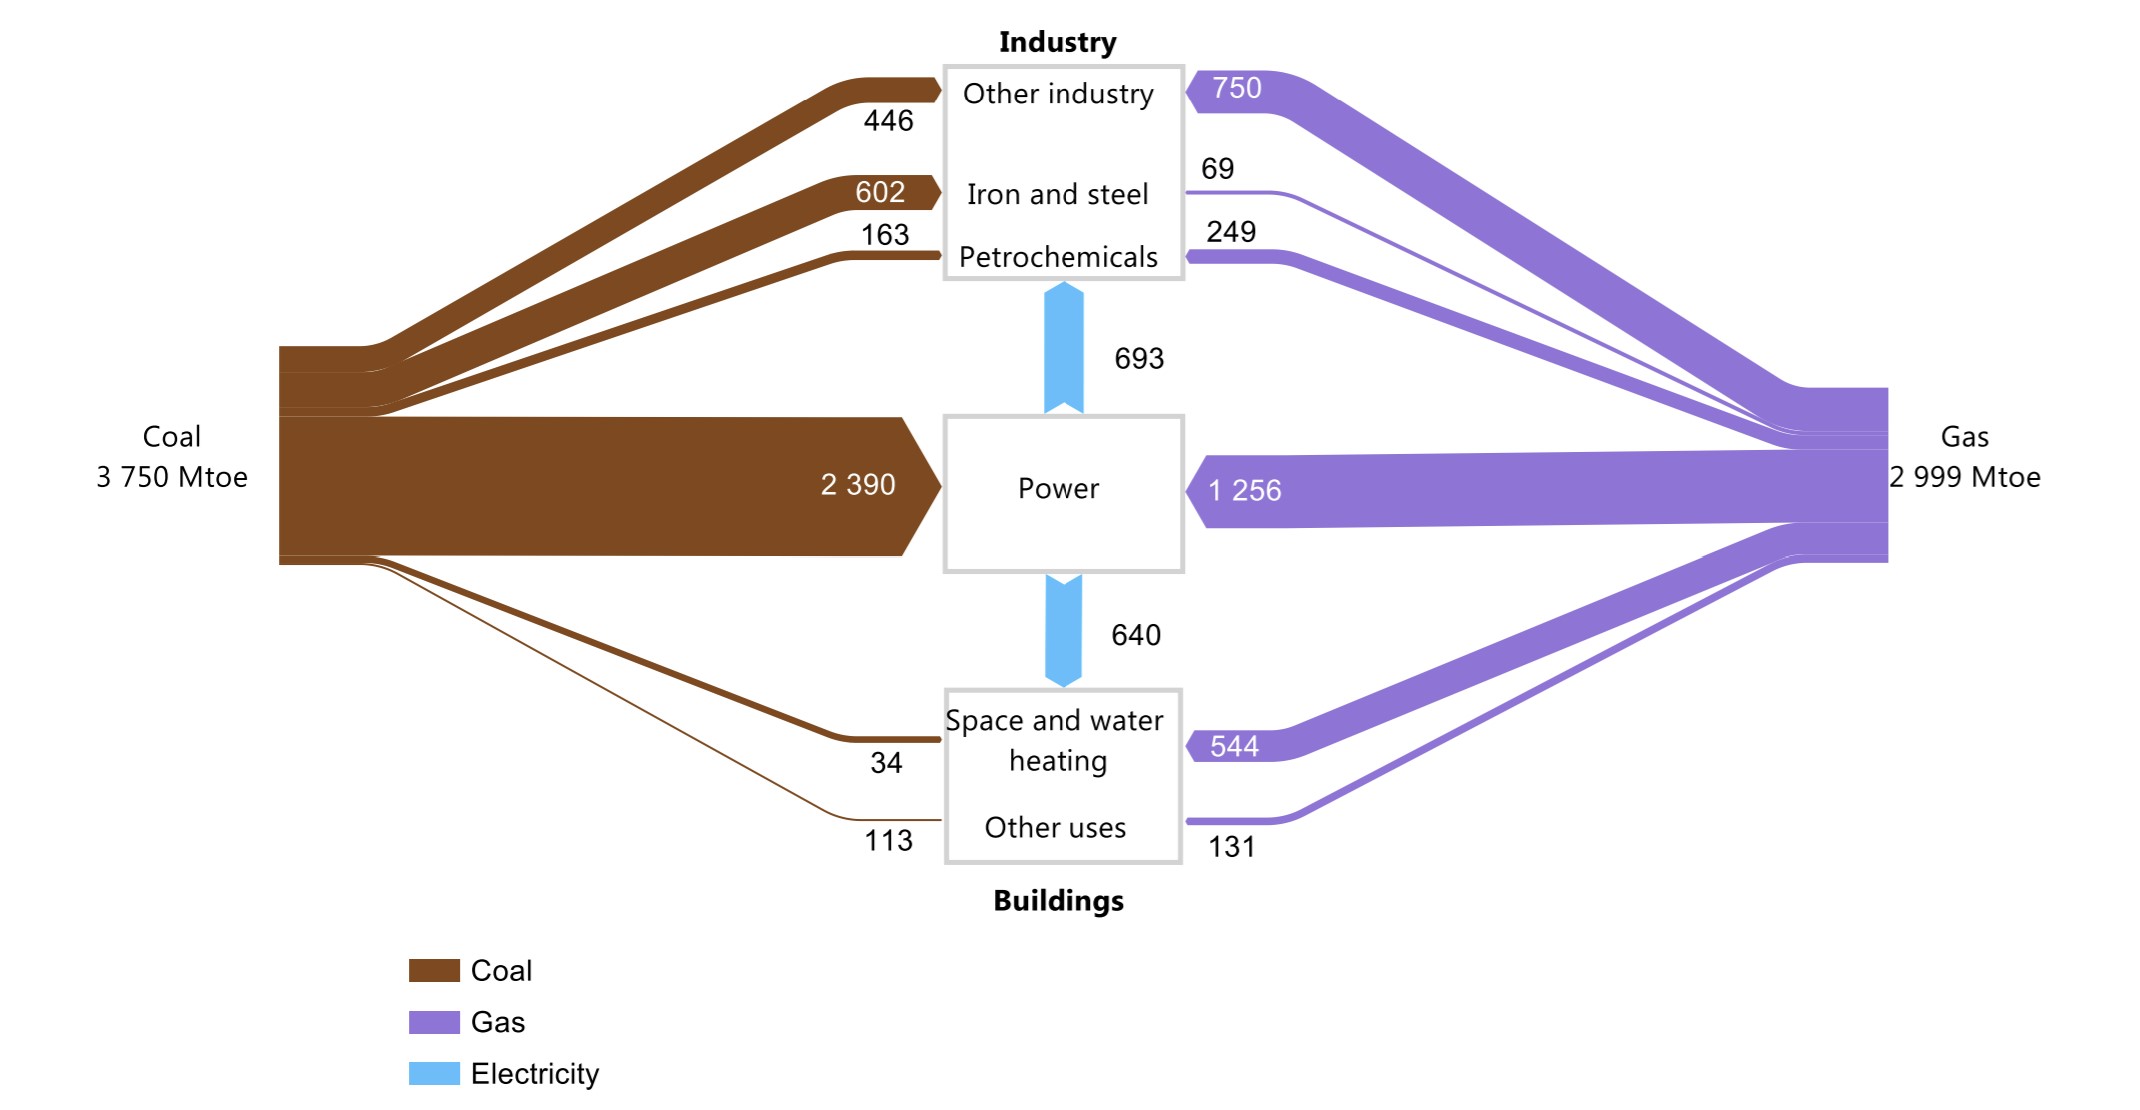
Figure 7: Selected flows of coal and gas in the global energy balance | IEA 2019
Although coal to gas switching has occurred outside the electricity sector (e.g., residential coal use in China[84]), there are few sectors that use a significant quantity of coal. For example, global coal use in 2017 in residential space and water heating was 34 Mtoe, equivalent to about 1% of gas production in that year. The exceptions are the steel and non-metallic minerals sectors, but there is limited evidence of gas emerging as a useful replacement for coal in these sectors[85].
The gas industry claims that gas can displace coal, even without coal use declining. This may be based on a hypothetical premise that, in the absence of gas, coal use would have been even higher. For example, a comparative life cycle analysis on the carbon impacts of Browse and Scarborough LNG that Woodside commissioned, rigorously quantifies hypothetical emissions reductions associated with coal-to-gas switching in scenarios where coal use grows.
Arguing that additional gas consumption in power generation is automatically displacing coal warrants challenging. The future of coal is already limited since cheaper alternatives are increasingly available, particulate matter pollution from coal is creating critical public health challenges for countries like China and India[86] and the three top markets for Australian LNG (Japan, China, and Korea) all have policies supporting aggressive buildout of domestic renewable electricity investment. As BlackRock asserted in 2017, “coal is dead”[87] and the availability of gas-fired substitutes was not the reason for this statement. We note there has been a recent, unexpected jump in global coal demand[88] and have addressed this below in What does the 2021/2022 energy crisis mean for gas and coal use?
Figure 7 also shows that gas is used in sectors that do not compete with coal. Some of these can be replaced with cheaper and lower carbon renewables with mature technologies, such as reverse cycle air conditioners for residential heating. Some sectors will likely need to rely on gas for longer, such as petrochemical feedstocks, with more time needed for the commercialisation of emerging technologies to displace gas in these sectors[89]. It is important to understand however that where gas use is not preventing the use of other fossil fuels, it cannot reduce emissions. The diversity of gas uses is also already considered in the Paris-aligned IEA scenarios, which show decreasing gas demand – they do not reflect additional demand.
Depending on generation technology, gas may reduce but not eliminate emissions from power generation if displacing coal-fired generation. However, industry has not provided evidence that this is happening at any material level, especially in Asia.
Coal is losing its dominance in Asian electricity grids, including the critical LNG markets of China and Japan. Gas plays a minor role in filling this gap, with variable renewables the largest source of new electricity capacity. Renewables are taking such a large portion of the investment that a case could be made that any additional gas is more likely to crowd out investment in renewables than displace coal.
Asian energy demand has rapidly increased with economic growth since 2000. As an example, Figure 8 charts Chinese electricity generation, showing that all significant energy sources have grown since 2000.
Figure 8: Historic Chinese generation of selected fuels (GWh) | BloombergNEF
Without observable, sustained reductions in coal use to date in Asian markets, it is not immediately obvious how to infer what replaces coal generation. However, two examples can provide some insight into interfuel competition in Asia. The first is investment trends in the Chinese electricity supply. The second is Japan’s response to a sudden reduction in nuclear energy.
China is the world’s largest coal consumer, so any evidence of gas displacing coal in China would support the industry’s narrative. As shown in Figure 9, Chinese annual coal power additions peaked in 2006 with over 80GW (>80% of new capacity) before decreasing to 35GW (~12%) in 2020. Over this time, hydro additions have also reduced, and a mix of PV, wind, nuclear and gas have taken larger shares of new capacity. The role of gas has been minor, with variable renewables adding more capacity than gas every year since 2008. The importance of variable renewables has only increased over time, with PV and wind adding 11 times the capacity of gas since 2015. In 2020, PV and wind each added more capacity than coal and more than six times the new capacity of gas power.
Figure 9: Annual Chinese generation capacity changes: Selected fuels (GW) | BloombergNEF
After the Fukushima disaster in March 2011, Japan turned off its fleet of nuclear reactors, with nuclear rapidly dropping from providing 28% of the electricity generation to 2%, as shown in Figure 10. Although nuclear and coal have different emission profiles and economic drivers, this still provides a natural experiment to test what happens when large, inflexible electricity supply is removed. Initially, this was replaced with generation from all available capacity - oil, gas, and coal.
Figure 10: Japanese Generation: Selected fuels (GWh) | BloombergNEF
The longer-term impact, shown in Figure 11, is for new capacity to be dominated by variable renewables - in this case, PV. This shows that, as you might expect, existing generators will ramp up in response to a sudden shortfall in electricity supply. But even with the opportunity for growth that was provided by this shock, Japanese investment in both gas and coal is losing out to PV capacity. More PV capacity has been built than gas capacity every year since 2013 and since 2015, Japanese investors have built 10 times more PV than gas capacity.
Figure 11: Annual Japanese generation capacity changes: Selected fuels (GW) | BloombergNEF
These examples demonstrate that whilst the claim that gas displaces coal has been made by Australian LNG producers since at least 1998, the evidence does not suggest gas has materially displaced coal in China or Japan in the last decade. We will now explore what the potential is for gas to displace coal in the current, critical decade for decarbonisation.
In the 2021 World Energy Outlook, the IEA explained what’s driving changes in gas use in the Announced Pledges Scenario (consistent with 2.1°C warming) between 2020 and 2030.[90] This data, replicated in Figure 12, shows that for each unit of coal displaced by gas, 5.8 units of gas are displaced by renewables. Although there is some coal-to-gas switching in this modelled scenario, it is dwarfed by renewables destroying gas demand. Figure 12 also shows that market growth is projected to drive gas demand, however assuming this growth is displacing coal demand ignores the fact that coal is being phased out for a range of reasons and if anything, it could be argued this gas is increasing emissions and displacing potential renewable energy buildout.
Figure 12: Changes in gas use 2020-2030 in APS (bcm) | IEA, World Energy Outlook, 2021
Figure 13 shows the emissions impact of fuel switching based on this IEA scenario, which is not aligned with the Paris Agreement. Coal-to-gas switching sees a global reduction of 88 MtCO2-e[91], whilst fuel switching away from gas reduces emissions by 864 MtCO2-e. That is, switching from gas to lower emission fuels has 10 times the global climate benefits of switching to gas from higher emission fuels.
As previously discussed, Australia’s main LNG importers (Japan, China, and South Korea) have all made net zero pledges. When focusing on just the countries that have made net zero pledges in the IEA data, emissions reductions associated with fuel switching from gas has 16 times the projected climate benefit of switching to gas.
Figure 13: Change in gas emissions due to fuel switching in APS from 2020 - 2030 (MtCO2-e) | IEA data & ACCR analysis
In 2020, the IEA summarised the changes in gas demand under the higher emission STEPS (consistent with 2.7°C[92]) for the power and industrial sectors. This is reproduced in Figure 14 and Figure 15, showing that coal-to-gas switching can result in a net emissions benefit in high emission scenarios, at least until 2025. This benefit is approximately 20 MtCO2-e per year between 2019 and 2030. Gas emissions in 2020 were however 7,165 MtCO2-e [93]. Efforts by the gas industry to justify a 7 GtCO2-e source of emissions due to a 0.02 GtCO2-e emission saving is a cynical attempt to distract from the harmful reality of its product.
The scale of changes in both IEA examples shows that fuel switching has a minor part to play in both the general energy mix and for reducing emissions. The change between the 2020 STEPS and the 2021 APS also shows that coal-to-gas switching quickly becomes dominated by gas-to-renewables switching in more ambitious climate action scenarios.
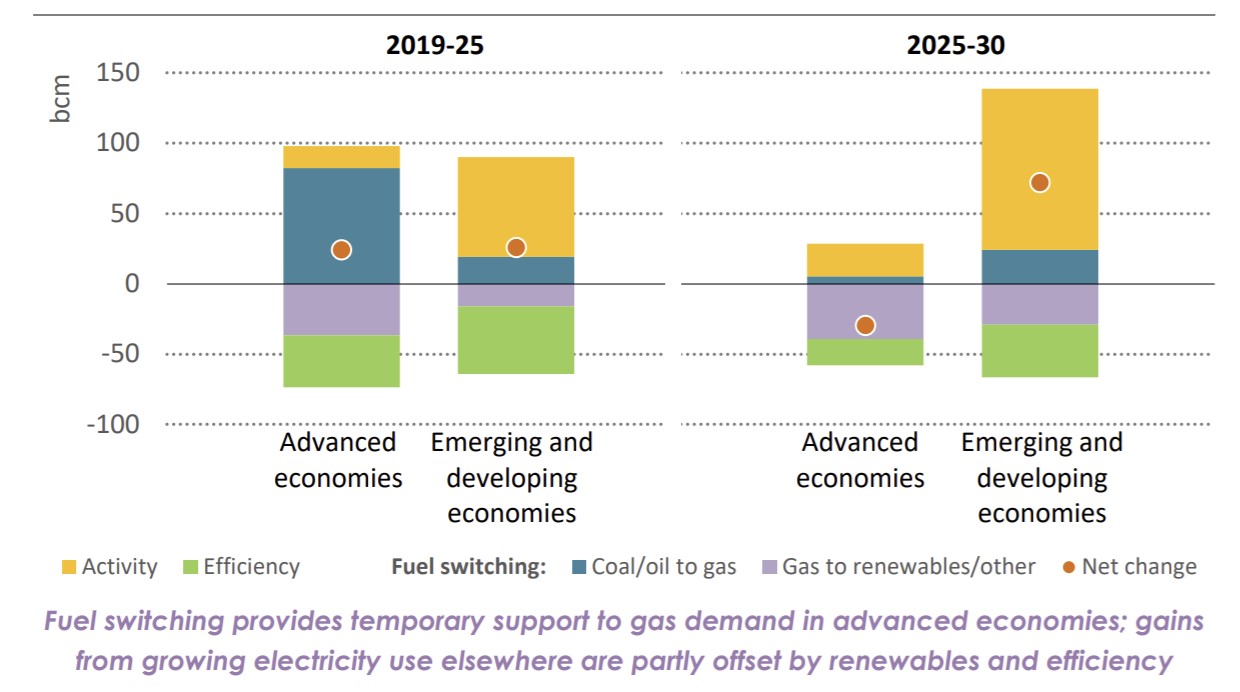
Figure 14: Changes in gas use 2020-2030 in STEPS power sector (bcm) | IEA, World Energy Outlook, 2020
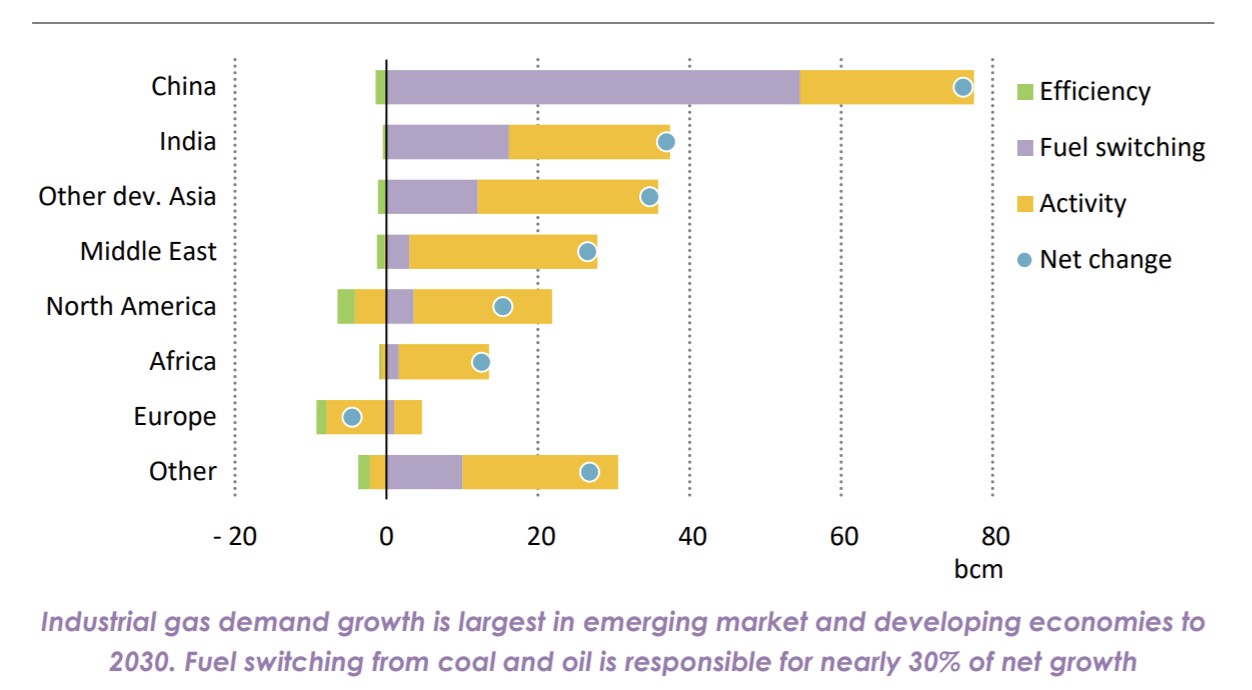
Figure 15: Changes in gas use 2020-2030 in STEPS industrial sector (bcm) | IEA, World Energy Outlook, 2020
Even in 2019, before the 2020 STEPS and 2021 APS analyses were released, the IEA saw the opportunity for coal-to-gas switching as insufficient to justify new investment in gas. In their 2019 Role of Gas report, the IEA stated, “The emissions reductions from coal-to-gas switching are significant but beating the most carbon-intensive fuel is not in itself a persuasive case for gas if there are lower emissions and lower-cost alternatives to both fuels. The falling cost of renewable technologies in the power sector is the clearest case in point. In many markets, wind and solar PV are already among the cheapest options for new generation. Moreover, the increased combustion of natural gas does not provide a long-term pathway to global climate objectives, so policy makers need to be wary about locking in gas-related emissions even as they reduce emissions from coal”[94].
Transitioning to a 1.5°C economy is unlikely to be smooth. The commodity price rises of 2021, including a 400% increase for LNG[95], show that prices are volatile when faced with unexpected shocks (in this case, extra demand driven by a post-COVID economic recovery). Claims have been made that these high gas prices were causing gas-to-coal switching[96]. As shown in Is there evidence of coal to gas switching to date?, shocks to the energy system can drive short term changes to the fuel mix, but renewables growth is inexorable and exceeds the impact of these shocks in the medium term. This trend of stable renewables growth holds true even through the COVID shocks: Wind and PV generation increased by 725 TWh over 2020 and 2021, whilst gas and coal both remained flat[97].
If anything, the price spikes of 2021 provide additional support for renewables investment, since the bulk of the cost of renewables is upfront capital which isn’t subject to future price changes.
Importantly, the current recovery in fossil fuel demand is also misaligned with the objectives of the Paris Agreement. After an almost 2 GtCO2-e drop in 2020, emissions bounced back by 1.5 GtCO2-e in 2021[98], resulting in a net reduction of 1.2% over those 2 years. Whilst investors in fossil fuels may be enjoying some short-term benefits, this is at the expense of the 55% reduction in carbon emissions required in the 2020s to remain on track for 1.5°C[99].
The International Energy Agency (IEA) publishes an annual World Energy Outlook (WEO), which includes a series of scenarios about future energy systems. The modelling is updated each year and although there is some continuity in scenario definitions, these are amended when they become less relevant to policy discussions. A recent addition to the IEA policy stable is the Net Zero Emissions (NZE) scenario, which was released in a standalone report in 2021 prior to COP26. The scenarios in the 2021 WEO[100] are:
One of the clearest insights from the 2021 NZE is that “there are no new oil and gas fields approved for development in our pathway”[101]. Although there are other pathways to achieve net zero by 2050, Dr Fatih Birol, Executive Director of the IEA defines the NZE as “the most technically feasible, cost‐effective and socially acceptable”[102] pathway available. As such, investment in new gas fields is an elegant litmus test for whether a gas company’s capital allocation is Paris-aligned.
The Australian LNG industry has frequently relied on IEA scenarios to justify its growth plans whilst inferring compatibility with the Paris Agreement, as detailed below:
In Figure 16 we chart global gas use in each 2021 WEO scenario, demonstrating that the role of gas diminishes in lower climate change outcomes, as expected for any fossil fuel. The only scenario that shows sustained increase in gas use is the STEPS, which results in 2.6°C of climate change.
Figure 16: Global gas use by scenario (EJ) | IEA, World Energy Outlook 2021
In 2021, Santos used out of date IEA data to show future gas and LNG demand being higher than the latest comparable forecasts. Woodside’s 2020 climate report used data that was current at the time but updating their analysis with the latest IEA data would lead to different conclusions.
Santos’ 2021 climate report[106] refers to 2018 IEA scenarios to show that in the SDS, gas use remains stable through to 2040. The IEA has since published its 2021 WEO which shows 2040 gas use in the SDS is 25% lower than the 2018 view, with a further 21% fall between 2040 and 2050. These differences in gas forecasts are presented in Figure 17 below. This data also shows that APPEA’s February 2021 claim that natural gas grows “consistently over the outlook period (to 2040) under all scenarios” is false.
Figure 17: Gas use in Paris aligned IEA scenarios (EJ) | IEA, World Energy Outlooks, 2018, 2020 & 2021
As shown in Figure 18, Santos’ 2021 climate report uses 2018 data which overstates Paris-aligned gas demand by up to 48% when compared to more recent publications. Santos used the same data in its 2020 climate change report[107].
Figure 18: Projected energy mix under 2018 SDS and 2040 gas demand in subsequent Paris aligned scenarios | Santos & IEA
Woodside’s net zero strategy from November 2020 showed LNG demand based on the IEA’s 2020 scenarios[108]. Presumably, Woodside was attempting to show that LNG demand rises in both IEA scenarios. The comparison between Woodside’s use of 2020 scenarios and the 2021 scenarios is presented in Figure 19. The 2021 data however shows that LNG demand is no longer resilient under Paris aligned scenarios. Demand instead plateaus in the SDS from 2030 and falls precipitously in the NZE from 2025.
Figure 19: LNG demand forecasts (bcm) | 2020 published by Woodside (left) and 2021 IEA (right)
The lower LNG demand in the 2021 SDS and NZE reduces prices and has significant impacts on the viability of recent investment decisions such as Woodside’s Scarborough and Santos’ Barossa. The Scarborough project is discussed further in How affordable is Australian LNG?
Santos and Woodside have been using IEA scenarios to justify the viability of their business model in low carbon scenarios for many years. In recent years, however, the IEA scenarios are showing lower levels of future gas and LNG demand. Santos avoided discussing this by using out of date IEA scenario data in its 2021 climate report. Although Woodside used up to date information in its 2020 climate report, repeating the analysis with subsequent IEA scenarios shows a much less resilient future for LNG demand. The next section shows just how precarious Scarborough’s business case is under the IEA’s SDS or NZE.
The Australian LNG industry frequently frames its product as an affordable energy solution. Within this section, we assess current data on electricity generation costs for a range of fuels.
Industry claims relating to the affordability of Australian LNG are as follows:
Elements of the Australian LNG industry are however beginning to understand that Australian LNG is not affordable. A Wood Mackenzie report commissioned by APPEA states that Australian LNG may be more expensive than customers are willing to pay: “As LNG FIDs continues apace outside of Australia there is a danger that the current wave of opportunity is missed, and future Australian LNG may end up priced out of the market”[112].
Figure 20 shows that renewables are now the cheapest form of electricity in countries representing 91% of the world’s electricity generation. The only major economy where gas is the cheapest form of energy is Russia, which is a major gas exporter so unlikely to be a customer for Australian LNG. This analysis is based on the levelised cost of energy/electricity (LCOE). An LCOE includes all costs of a generation facility: capital, maintenance, fuel, decommissioning, explicit carbon costs, inflation etc. It excludes subsidies.
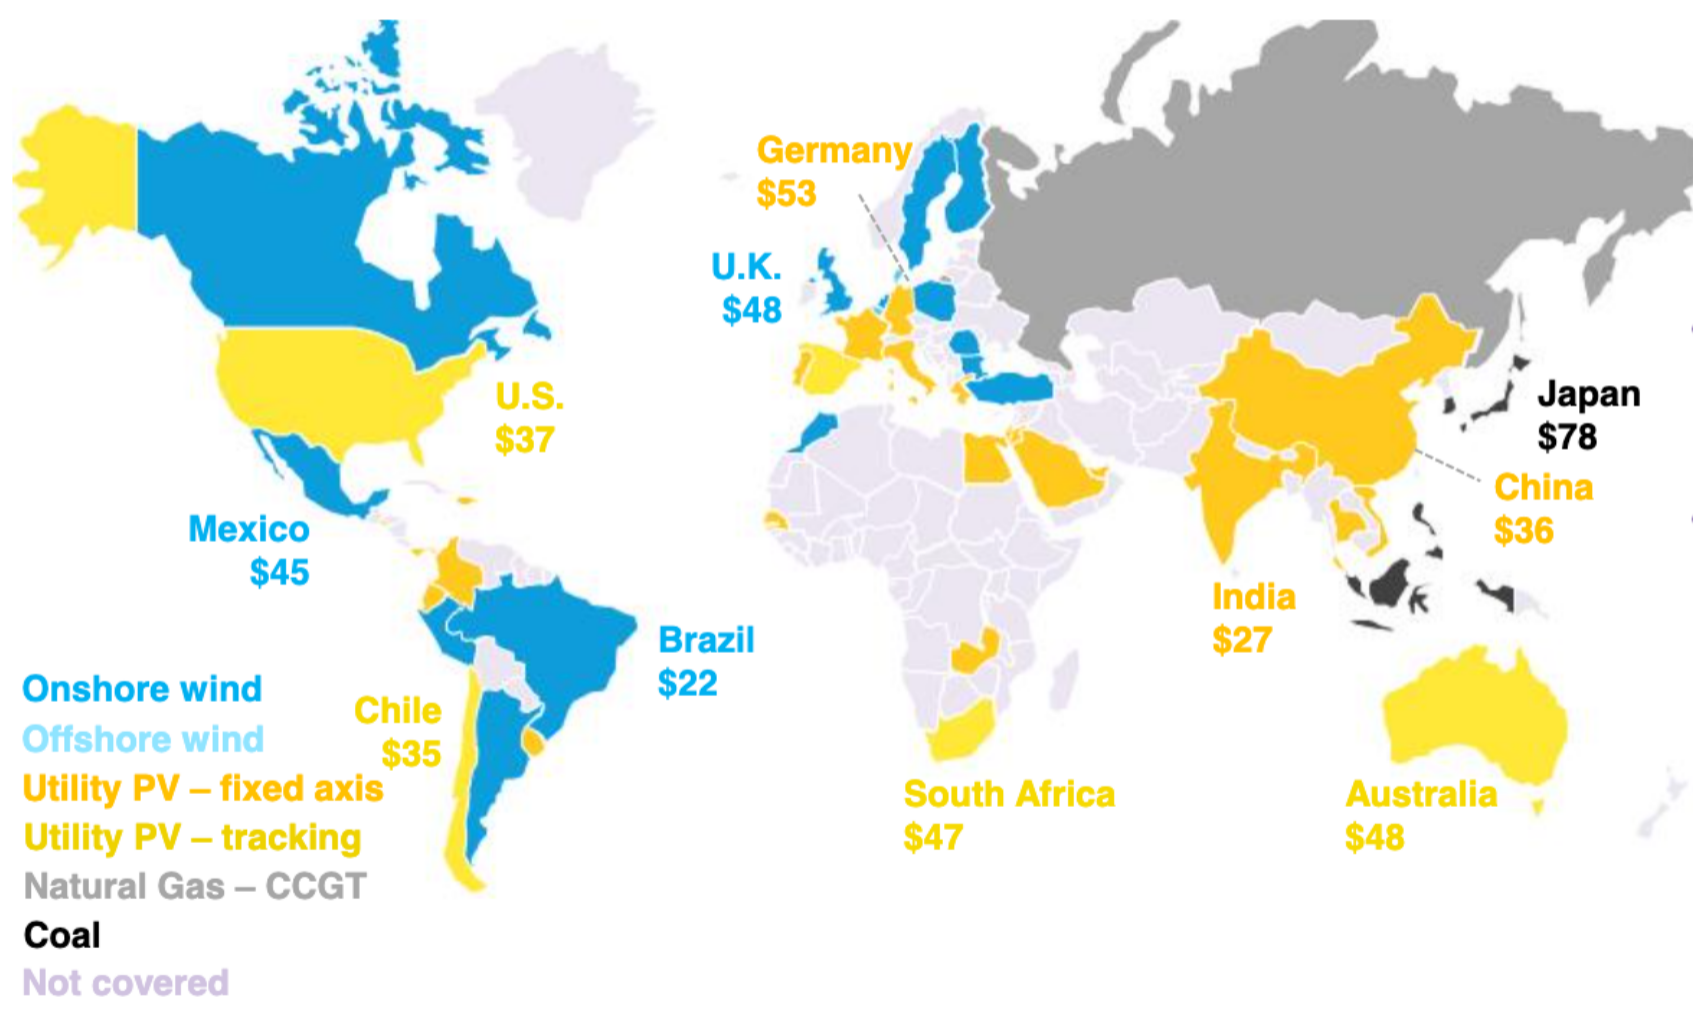
Figure 20: Cheapest new electricity sources | BloombergNEF, 1H 2021 LCOE Update 2021, p. 15.
Using China as a specific example, the LCOE of gas electricity is a little over $100/MWh. A new wind farm in China has an LCOE of under $50/MWh whilst a new solar PV farm in China is under $40/MWh.
With the rapid recent growth of renewable electricity in emerging markets, the competition for new capacity is clearly being won by renewables (see: Gas displacing coal: Has it happened? Will it happen? above). This has shifted attention to how quickly new renewable generators could displace existing fossil fuel facilities. This is seen as a key tipping point since it enables grids to economically build renewable generation faster than they could if existing energy infrastructure operated until the end of its useful life. Figure 21 compares the LCOE of renewables against just the operating costs of incumbent fossil fuel generators in China. On this basis, the Chinese market has already reached the point where a new PV facility can outcompete an existing gas facility on a cost basis and a new wind turbine is about break even. Cost forecasts combined with the rising market price of carbon emissions strongly suggests new renewables will extend their competitive advantage over existing gas generators. Figure 22 shows that similar dynamics apply in India, where operating an existing gas plant is more expensive than building a new wind or PV generation facility (the dataset did not include an LCOE for gas generation).
Figure 21: Chinese electricity costs: selected sources | BloombergNEF, 2021
Figure 22: Indian electricity costs: selected sources | BloombergNEF, 2021
Despite the recent falls in the cost of PV and wind, these technologies are intermittent, creating new challenges around ensuring a stable electricity supply. This is a surmountable problem and there are several strategies that can be employed to manage this. The World Energy Council lists eight technologies and eight market design principles that can integrate higher levels of variable renewable electricity[113]. Greater flexibility of generation is one of these technologies and OCGTs are well suited to this. Another technology is energy storage, such as pumped hydro or batteries. The costs of batteries have fallen on similar trajectories to PV and wind for the last decade. Figure 23 shows that battery storage systems are now cost-competitive with or cheaper than OCGTs.
Figure 23: Global LCOE for utility-scale battery storage and OCGT ($/MWh) | BloombergNEF, 2021
With near-zero marginal cost and effectively instant response times, batteries will be dispatched before peaking gas plants[114]. BloombergNEF trends show that battery storage price declines are expected to continue, allowing these systems to capture a progressively larger portion of the firming services market in an increasing number of markets. This could in turn decrease the run time for OCGT gas peaking plants, which (although not modelled by BloombergNEF) would increase their LCOE.
BloombergNEF’s 2020 New Energy Outlook (NEO) distinguishes between gas baseload CCGT and peaking OCGT generators. Although the NEO’s Economic Transition Scenario (ETS) is far from Paris-aligned (being 3.3°C[115]), it is, however, instructive about the role that peaking gas can play in a decarbonising grid. Figure 24 shows the capacity of and generation from Chinese combined-cycle and peaking gas from 2010 to 2050 under the ETS[116]. Combined-cycle capacity remains flat whilst new peaking gas plants (OCGT) result in a tripling of gas capacity. Despite this additional capacity, gas generation and associated demand actually decrease, with demand destruction of combined-cycle gas only partially offset by additional peaking gas demand. As discussed above, IEA scenarios with lower warming trajectories have less gas use, suggesting that aligning the NEO to the Paris Agreement would further reduce gas use.
Figure 24: Mix of Chinese CCGT and OCGT for the ETO scenario | BloombergNEF, 2020
This example shows that even where gas has a role providing some level of firming capacity, this will have low utilisation and will not support increased Australian LNG exports.
The latest IEA scenarios include gas prices for selected markets. When compared to the recently quoted cost of supply for Scarborough (as the most recent example of an Australian LNG final investment decision), Scarborough is too expensive to generate a profit in the Paris-aligned NZE and SDS scenarios in key LNG markets. This is not surprising in the context of the NZE that stated “no new gas fields are needed in the NZE beyond those already under development”[117]. Figure 25 shows that future Japanese gas prices in the SDS and NZE are both below Scarborough’s Cost of Supply (CoS) of $5.8/MMBtu[118].
As discussed above, the energy price spikes seen in 2021 should not be mistaken as a sign that LNG consumption is aligned with the Paris Agreement’s goals. They are instead a reminder that fossil fuel markets are volatile, requiring producers and consumers to manage this risk.
Figure 25: Japanese gas prices by IEA scenario, relative to Scarborough cost of supply (USD / MMBtu) | IEA 2021
Carbon Tracker, using Rystad cost estimates, found that Scarborough is even too expensive for the IEA’s highest temperature scenario: “Woodside is preparing to sanction Pluto Train 2, a large project with breakeven costs high enough to not fit even within STEPS” [119].
This may explain why Japanese buyers are becoming reluctant to take strong LNG positions. JERA President Satoshi Onoda recently explained that “it has become difficult for us to continue with large, long-term LNG contracts given the development of the global LNG market, global decarbonisation push, the liberalisation of the domestic electricity and gas markets”[120].
Figure 26 shows Woodside’s stated Scarborough CoS in August 2021 of $6.8/MMBtu[121] was above the Chinese gas price assumptions in the SDS and NZE. When Woodside sold down part of Pluto 2 to Global Infrastructure Partners (GIP), whilst retaining much of the project risk,[122] Woodside’s quoted CoS for Scarborough dropped to $5.8/MMBtu. Despite this deal, Woodside’s Scarborough investment is still too expensive to be profitable in the Chinese market under the NZE scenario. Woodside’s estimated >13.5%[123] rate of return announced with its final investment decision is likely based on LNG price assumptions misaligned with the Paris Agreement goals and inflated by the financial engineering of the GIP deal.
Figure 26: Chinese gas prices by IEA scenario, relative to Scarborough cost of supply (USD/MMBtu) | IEA, 2021
LNG projects are capital intensive but have low operating costs. This means that once FID is made and construction contracts are committed, opportunities to reduce the CoS are limited. If prices fail to meet the business case assumptions, this will impact investor returns, irrespective of future efforts by Woodside to constrain operating costs.
BloombergNEF data shows that gas generation is an expensive form of electricity. It is not only more expensive than renewables on a like for like basis, but in many cases is also more expensive than renewables when the capital costs of the gas generator are ignored. In the firming capacity market, OCGT gas peaking plants are losing their cost advantage over batteries and the incremental gas consumption from gas peaking plants is a small fraction of existing gas demand.
Within the broader energy market, LNG from the Scarborough LNG project (as a proxy for incremental Australian LNG) appears to be too expensive to generate target returns on equity when supplying to Asia under the NZE and has limited market opportunities in the SDS. Woodside had access to the data showing that Scarborough gas is too expensive for key markets under Paris aligned scenarios when it made the FID on Scarborough. This suggests Woodside is knowingly investing in, and contributing to, a future that fails to meet the Paris targets.
Australia’s gas industry claims that LNG is a cheap, affordable fuel that contributes to the goals of the Paris Agreement since it has low emissions and displaces coal in Asia. This mantra has been repeated for decades, resulting in widespread acceptance amongst investors, media, government, and other stakeholders.
If these assertions were ever true, they no longer are.
Any discussion of lower emission electricity needs to start with a recognition that renewable energy sources have no combustion or fugitive emissions. Gas, like coal and oil, is a fossil fuel that emits greenhouse gases when combusted. When used to generate power, gas emits more than half and up to 93% of coal. Gas distribution networks can be particularly emissions-intensive due to fugitive emissions. Despite promoting the efficiency of gas generation, nine out of 10 Australian LNG facilities use less efficient “open-cycle” or steam turbine technology to generate electricity for their own use.
There is no clear evidence that gas has materially displaced coal in Asia. Examples of gas displacing coal in Asia are either immaterial or concentrated in abrupt shocks, such as the Fukushima earthquake in Japan, or the unexpectedly rapid economic recovery from COVID. The medium-term trend of renewables outcompeting both coal and gas appears inexorable.
Gas only materially displaces coal in high emissions scenarios. At a global level, gas appears to successfully displace coal in the IEA’s Stated Energy Policy Scenario where emissions exceed the goals of the Paris Agreement, with warming in 2100 projected to be 2.6°C. Even in this scenario, the emission savings are a small fraction of gas’ global emissions. In the lower emission APS (consistent with 2.1°C warming), gas-to-renewables switching avoids 10 times as many emissions as coal-to-gas switching. The APS is still not Paris aligned however and Paris aligned scenarios have significantly lower levels of gas demand.
More gas does not reduce global emissions. We know this since IEA’s latest Paris-aligned scenarios use less gas. The Net Zero Emissions scenario precludes any development of new gas fields from 2021.
Australian gas delivered to Asia is expensive. For power generation, gas is more expensive than renewables, in many cases, this remains true even if the capital costs of the gas generator are ignored. Batteries are now cost-competitive with, or cheaper than, gas generators for the provision of grid support.
LNG companies use outdated data to demonstrate LNG’s resilience. Santos avoided discussing the worsening outlook for gas in recent Paris-aligned scenarios, by using out of date data in its 2020 and 2021 climate change reports. Although Woodside used up to date data in its 2020 climate report, the IEA’s 2021 data shows a less resilient future for LNG. In the 2021 scenarios, Woodside’s Scarborough LNG project is a precarious investment when compared to future gas prices in Japan or China. The 2021 data was available when Woodside made the final decision to invest in Scarborough.
Despite voicing support for the Paris Agreement, Australia’s listed LNG producers are betting on the failure of Paris.
This report is intended to rebut the LNG industry’s claims with quality data and insights. We encourage institutional investors that support the Paris Agreement to draw on this paper in their engagement with companies in their portfolios. Investors have a range of options available to them, including to:
Please read the terms and conditions attached to the use of this site.
Mairi Barton, “Greenhouse plea on Gas”, The West Australian, 27 Oct 1998.\ ↩︎
Wood Mackenzie, Australia Oil and Gas Industry Outlook Report, 2020. ↩︎
AFR, Team Australia backs Woodside’s Scarborough LNG, 23 November 2021. ↩︎
The Hon Angus Taylor MP, “Remarks to the Bank of America Japan Conference”, 30 Aug 2021. ↩︎
For example: ERM, Comparative Life Cycle Assessment: Browse and Scarborough, 2020. ↩︎
APPEA, Australia’s Cleaner Energy Future: Incorporating the third edition of the APPEA Climate Change Policy Principles, 2021, p. 1. ↩︎
Santos, Climate Change Policy, 2019. ↩︎
Woodside, 2020 Annual Report: Incorporating Appendix 4E, 2020, p. 43. ↩︎
Origin, Climate Change Management Approach, 2021, p. 1. ↩︎
Australian Government, Department of Industry, Science, Energy and Resources, Resources and Energy Quarterly, December 2021. ↩︎
Ibid. ↩︎
International Gas Union, 2021 World LNG Report, 2021, p. 16. ↩︎
Office of the Chief Economist, Resource and Energy Quarterly, Department of Industry, Science, Energy and Resources, 2021, p. 80. ↩︎
Wood Mackenzie, Australia Oil and Gas Industry Outlook Report, 2020, p. 13. ↩︎
Woodside Investor Briefing Day, 2020. ↩︎
Australian Government, Department of Industry, Science, Energy and Resources, Resources and Energy, Supporting Australia’s Resources Sector, January 2022. ↩︎
WA Government Department of Mines and Petroleum, The Canning Basin. ↩︎
Wood Mackenzie, Australia Oil and Gas Industry Outlook Report, 2020, p. 2. ↩︎
The Hon Angus Taylor MP, Media Release: Gas-fired recovery, 15 Sept 2020. ↩︎
Tony Wood & Guy Dundas, “Flame out: the future of natural gas,” 15 Nov 2020, The Grattan Institute https://grattan.edu.au/report/flame-out-the-future-of-natural-gas, accessed 27 Jan 2022. ↩︎
Marzuki, Fauziah, Four Ways to Think About the Future of Natural Gas, BloombergNEF, 2021, p. 11. ↩︎
BloombergNEF, Bloomberg Terminal’s AHOY JOURNEY. ↩︎
IEA, 2021 World Energy Outlook, 2021. p. 317. ↩︎
BloombergNEF, Bloomberg Terminal’s AHOY JOURNEY. ↩︎
Wood Mackenzie, Qatar Petroleum takes FID on North Field East, 2021. ↩︎
Prime Minster Modi’s Independence day speech, 15 August, 2021“India is not Energy independent. It spends over Rs. 12 lakh crores [USD 160 bn] on importing energy. As we celebrate 75 years of Independence, we have to ensure that India becomes AatmaNirbharin [self-sufficient] energy production too.”\ ↩︎
BloombergNEF, Global LNG Market Outlook 2040, supporting data workbook. ↩︎
BloombergNEF, Decarbonizing Steel: Technologies and Costs, August 25, 2021. ↩︎
Japan’s Nationally Determined Contribution, 2021. ↩︎
Taiwan Today, “President Tsai reaffirms Taiwan’s commitment to achieving net zero goal by 2050,” 8 Nov 2021 https://taiwantoday.tw/news.php?unit=2&post=210361&unitname=Politics-Top-News&postname=Tsai-reiterates-Taiwan’s-commitment-to-join-like-minded-partners-in-achieving-net-zero-emissions-by-2050. ↩︎
China’s Achievements, New Goals and New Measures for Nationally Determined Contributions (Unofficial Translation), 2021, p. 2. ↩︎
Agency for Natural Resources and Energy, Outline of Strategic Energy Plan, Ministry of Economy, Trade, and Industry, 2021, p. 12. ↩︎
ACCR analysis. ↩︎
The Republic of Korea’s Enhanced Update of its First Nationally Determined Contribution, 2021. ↩︎
Ministry of Economy and Finance, Press Release: Government Announces Overview of Korean New Deal, 2020. ↩︎
Ministry of Environment, Korea, “Presenting a Korean-style green classification system,” 31 Dec 2021. https://www.me.go.kr/home/web/board/read.do?pagerOffset=0&maxPageItems=10&maxIndexPages=10&searchKey=&searchValue=&menuId=10525&orgCd=&boardId=1498700&boardMasterId=1&boardCategoryId=&decorator=, accessed 7 Jan 2021. ↩︎
The taxonomy limit is 340 gCO2-e/kWh, with a reduction plan to achieve 250 gCO2-e/kWh. By comparison, the cleanest gas generator in Australia emitted 370 gCO2-e/kWh, based on FY20 data from the Clean Energy Regulator. ↩︎
China’s Achievements, New Goals and New Measures for Nationally Determined Contributions (Unofficial Translation), 2021, p. 2. ↩︎
Climate Action Tracker, December 2021. ↩︎
UNFCCC, The Paris Agreement, 2022. ↩︎
Wood Mackenzie, Japan’s new 2030 energy mix unveils radical plans to transform the energy system, 27 July 2021. ↩︎
Woodside, Annual Report 2020, p. 23. ↩︎
Origin, Resilience of Origin’s Generation Portfolio to a Low-Carbon Economy: Scenario Analysis Under 2C and 1.5C Warming Pathways, 2019, p. 13. ↩︎
Santos, 2020 Climate Change Report, 2021, p. 31. ↩︎
APPEA, “Natural gas and new technology part of the solution to climate change”, 2021. ↩︎
Wartsila, Combined-cycle plant for power generation. ↩︎
LVH efficiency for current GE gas turbine models: ge.com/gas-power/gas-turbines accessed 21 Dec 2021. ↩︎
OpenNEM, https://opennem.org.au/energy/nem/?range=1y&interval=1w, accessed 21 Dec 2021. ↩︎
Woodside, Annual Report 2020, p. 23. ↩︎
Bethel Afework, Jordan Hanania, Kailyn Stenhouse and Jason Donev, “Supercritical coal plant,” 25 June 2018. https://energyeducation.ca/encyclopedia/Supercritical_coal_plant. ↩︎
Hardisty, Clark and Hynes, Life Cycle Greenhouse Gas Emissions from Electricity Generation: A Comparative Analysis of Australian Energy Sources, Energies, 2012, pp. 872 - 897. Note in the 10 years since this paper was written, the mix of coal generators has changed, but the underlying efficiency of each technology has not. ↩︎
OpenNEM, https://opennem.org.au/energy/nem/?range=1y&interval=1w, accessed 21 Dec 2021. ↩︎
BloombergNEF, 2021 New Energy Outlook, underlying data. ↩︎
BloombergNEF, 2020 New Energy Outlook, underlying data. ↩︎
Chevron, Gorgon Gas Development Revised and Expanded Proposal: Public Environmental Review, 2008, p. 256. ↩︎
Chevron, Draft Environmental Impact Statement / Environmental Review and Management Programme for the Proposed Wheatstone Project, 2010, p. 97. ↩︎
APLNG, Australia Pacific LNG Project Environmental Impact Assessment, 2010, Volume 4: LNG Facility, Chapter 3: Project Description, p 71. ↩︎
Santos, Gladstone LNG Project - Environmental Impact Statement, 2009, p 8.9.2. ↩︎
Shell, Queensland Curtis LNG Project Environmental Impact Statement (EIS), 2009, Volume 7, Chapter 2, p. 13. ↩︎
National Pollutant Inventory. 2019/2020 report for Woodside Energy Ltd, Karratha Onshore Gas Treatment Plant - Via Karratha, WA. ↩︎
Woodside, Pluto LNG Development, Draft Public Environmental Report / Public Environmental Review, 2006, p. 64. ↩︎
ConocoPhillips, Darwin LNG Operations Environmental Management Plan, rev 3, 2018, p. 42. ↩︎
INPEX, “Ichthys LNG Project combined cycle power plant fires-up,” 10 Nov 2017. https://www.inpex.com.au/news-and-updates/media-centre/media-releases/ichthys-lng-project-combined-cycle-power-plant-fires-up/, accessed 22 Dec 2021. ↩︎
Shell Development (Australia) Prelude Floating LNG Project: EIS Supplement-Response to Submissions, 2010, p. 7. ↩︎
Santos, 2020 Climate Change Report, 2021, p. 35. ↩︎
Carbon Brief, “Explained: Fugitive methane emissions from natural gas production,” 3 July 2014, https://www.carbonbrief.org/explained-fugitive-methane-emissions-from-natural-gas-production. Accessed 28 Nov 2021. ↩︎
For example: Ramón A. Alvarez, et al, Greater focus needed on methane leakage from natural gas infrastructure, Proceedings of the National Academy of Sciences of the United States of America, 2012. ↩︎
Dimitri Lafleur, Aspects of Australia’s fugitive and overseas emissions from fossil fuel exports, University of Melbourne, 2018. ↩︎
Department of Industry, Science, Energy and Resources, National Greenhouse and Energy Reporting (Measurement) Determination 2008, 2021, p. 194. ↩︎
Woodside, Annual Report 2020, p. 23. ↩︎
ACCR calculations principally based on NGER Measurement Determination Method 1. LNG processing and shipping assumes these stages consume 10% of raw gas. Gas extraction is based on conventional wells. High and Low distribution fugitives based on proxies of SA (4.9% losses) and Tasmanian (0.2% losses) domestic gas grids. Coal processing and shipping based on Hardisty et al, Life Cycle Greenhouse Gas Emissions from Electricity Generation: A Comparative Analysis of Australian Energy Sources, 2012. Since domestic gas is not converted to electricity, this analysis is on an GJ, rather than MWh basis. ↩︎
APPEA, Media release: cleaner energy from gas, 2021. ↩︎
Santos, Sustainability and Climate Change webpage, 2021, https://www.santos.com/sustainability/climate-change/. Accessed 28 Nov 2021. ↩︎
Origin, 2021 Sustainability Report, 2021, p. 24. ↩︎
ERM, Comparative Lifecyle Assessment: Browse and Scarborough, 2020, p. ii. ↩︎
Wood Mackenzie, Australia Oil and Gas Industry Outlook Report, 2020, p. 12. ↩︎
Department of Industry, Science, Energy and Resources, “National Greenhouse Gas Inventory: December 2018,” May 2019, The Australian Government, https://www.industry.gov.au/data-and-publications/national-greenhouse-gas-inventory-december-2018. Accessed 28 Nov 2021. ↩︎
The Hon Angus Taylor MP, “Remarks to the Bank of America Japan Conference”, 30 Aug 2021. ↩︎
Morgan Stanley Research, LNG as the world transitions to Net Zero?, October 2021 . ↩︎
AFR, Team Australia backs Woodside’s Scarborough LNG, 23 Nov 2021. ↩︎
IEA, The Role of Gas in Today’s Energy Transition, slide 7. ↩︎
IEA, World Energy Outlook, 2021, p. 298. ↩︎
International Energy Agency, The Role of Gas in Today’s Energy Transitions, 2019, p. 29. ↩︎
Feng Hao, “China softens approach to home heating switch,” 6 Dec 2018, China Dialogue, https://chinadialogue.net/en/energy/10964-china-softens-approach-to-home-heating-switch/. ↩︎
For example, Sha, et al, 1.5°C Steel: Decarbonizing the Steel Sector in Paris-Compatible Pathways, E3G and Pacific Northwest National Laboratory, 2021. This notes natural gas based direct reduction iron (DRI) is a lower carbon technology, but notes concern about locking in a process that isn’t fully decarbonised and doesn’t provide an outlook for market share of natural gas based DRI. ↩︎
Meng Gao et al., “The impact if power generation emissions on ambient PM2.5 pollution and human health in China and India,” Environment International, vol 121, Part 1, December 2018, pp. 250-259. ↩︎
Jenny Wiggins, “BlackRock says coal is dead as it eyes renewable power splurge”, AFR, 26 May 2017. ↩︎
IEA, Global Energy Review 2021, April 2021. ↩︎
IEA, The challenge of reaching zero emissions in heavy industry, 2020. ↩︎
IEA, World Energy Outlook, 2021, p. 27. ↩︎
Emissions calculations based on combustion emissions only, using NGER energy density and emission factors for unprocessed natural gas and bituminous coal. Exclude market growth, to focus on fuel switching impacts. ↩︎
IEA, World Energy Outlook, 2020, p. 87. ↩︎
IEA, World Energy Outlook, 2021, p. 298. ↩︎
IEA, The Role of Gas in Today’s Energy Transitions, 2019, p. 42. ↩︎
LNG Japan/Korea Marker PLATTS Future Historical Data, accessed 11 Jan 2022. ↩︎
Angela Macdonald-Smith, “Little Chance, if any of 1.5 degrees as coal rebounds,” AFR, 17 Dec 2021. ↩︎
International Energy Agency, Global Energy Review 2021: Assessing the effects of economic recoveries on global energy demand and CO2 e emissions in 2021, 2021. ↩︎
IEA, Global Energy Review 2021: Assessing the effects of economic recoveries on global energy demand and CO2 emissions in 2021, 2021, p. 10. ↩︎
UN Environment Program, The Heat is On: A world of climate promises not yet delivered, 2021, p. xv. This also notes that a 30% reduction is required to remain on the least cost path for a 2°C outcome. ↩︎
IEA, World Energy Outlook, 2021, p. 27. ↩︎
IEA, Net Zero by 2050: A Roadmap for the Global Energy Sector, 2021, p. 102 ↩︎
IEA, Net Zero by 2050: A Roadmap for the Global Energy Sector, 2021, p. 3 ↩︎
Santos, 2021 Climate Change Report, 2021, p. 5. ↩︎
Woodside, Better is a Lower-Carbon Future. Supporting Net Zero: Woodside’s Climate Strategy, 202, p. 6. ↩︎
APPEA, Australia’s Cleaner Energy Future: Incorporating the Third Edition of the APPEA Climate Change Policy Principles, 2021, p. 15. ↩︎
Santos, 2021 Climate Change Report, 2021, p. 14. ↩︎
Santos, 2020 Climate Change Report, 2020, p. 18. ↩︎
Woodside, Better is a Lower-Carbon Future. Supporting Net Zero: Woodside’s Climate Strategy, November 2020, p. 6. Note the Woodside graph has been reproduced using the IEA’s original units of bcm ↩︎
Santos, 2021 Climate Change Report, 2021, p. 8. ↩︎
Woodside, Better is a Lower-Carbon Future. Supporting Net Zero: Woodside’s Climate Strategy, 2020, p. 3. ↩︎
APPEA, “Scarborough FID a major boost for WA gas industry”, 24 Nov 2021. ↩︎
Wood Mackenzie, Australia Oil and Gas Industry Outlook Report, 2020, p. 13. ↩︎
World Energy Council, World Energy Perspectives: Renewables Integration, 2016, pp. 45-47. ↩︎
For example: AEMO, Initial operation of the Hornsdale Power Reserve Battery Energy Storage System, 2018, p. 6. ↩︎
BloombergNEF, New Energy Outlook 2020: Executive Summary, 2020, p. 25. The ETS is an economics-based forecast that only includes government policies, such as carbon prices, where these are embedded in mature policies. ↩︎
BloombergNEF, 2020 New Energy Outlook, underlying data. ↩︎
IEA, IEA, Net Zero by 2050: A Roadmap for the Global Energy Sector, 2021, p. 102 ↩︎
Woodside, Woodside Agrees to Sell 49% in Pluto Train 2 to GIP, ASX, November 2021, p. 1. ↩︎
Carbon Tracker, Adapt to Survive: Why oil companies must plan for net zero and avoid stranded assets, 2021, p. 8. ↩︎
Yuka Obayashi, “Japan’s JERA says not renewing long-term deals on Qatargas 1 LNG project,” 25 Nov 2021, https://www.nasdaq.com/articles/japans-jera-says-not-renewing-long-term-deals-on-qatargas-1-lng-project. Accessed, 25 Nov 2021. ↩︎
Woodside, Woodside Half-Year 2021 Results, ASX, August 2021 p. 8. ↩︎
Woodside, Woodside Agrees to Sell 49% in Pluto Train 2 to GIP, ASX, November 2021, p. 1. Note this updated CoS is a Woodside specific value so does not reflect the economics of the whole Scarborough project. ↩︎
Woodside, Scarborough FID Teleconference and Investor Presentation, 2021, p. 4. ↩︎
Get email updates about new ACCR research and shareholder advocacy on specific topics of interest to you.
Sign Up