1. Executive Summary
Introduction
Australia exported more LNG than any other country in 2022, a scale achieved by eight projects that reached Final Investment Decision (FID) between 2007 and 2012; Woodside’s Pluto project, Chevron’s Gorgon and Wheatstone projects, three east coast LNG plants supplied by coal seam gas, Inpex’s Ichthys project and Shell’s Prelude. We refer to these projects as ‘Australia’s LNG growth wave’.
Australia’s LNG growth wave deployed an immense $234 billion in capital expenditure (capex) - more than twice the current market capitalisation of Australia’s 20 largest fossil fuel companies. The ability of industry to attract this substantial investment has widely been interpreted by Australian LNG operators and market analysts as a measure of success. Australia’s LNG industry now generates significant revenue, including $35 billion of Free Cash Flow (FCF) in 2022 alone, boosting company coffers.
However, attracting capex and generating revenue does not necessarily create value for shareholders. Value is created when a company generates returns over and above its cost of capital. Similarly, assessing current cash flows alone does not give an indication of how well company management performed in delivering these projects.
This report looks under the hood of Australia’s LNG growth wave, examining whether it has created value for shareholders. It is a critical issue to examine at this time because Australia’s LNG industry is looking to progress new projects, including within the Beetaloo, Canning and Browse basins. Insights into how LNG projects were delivered and the value they appear to have destroyed may inform an investor’s assessment of the current claims made by the LNG operators about additional investments. This is especially relevant as the energy transition accelerates, with the IEA’s projections now showing that gas use peaks before 2030 in all scenarios.
Appendix 1 describes the key sources, methodology and terminology.
Key Findings
While Australia’s LNG growth wave is currently generating strong cash flows, it does not appear to have generated value for shareholders, since returns do not meet the cost of capital.
According to our analysis, Australia’s LNG growth wave appears to have eroded $19 billion of shareholder value. The key cause for Australia’s LNG growth wave delivering suboptimal returns appears to be:
- every project exceeding its capex guidance provided at FID. These cost overruns ranged from 3% to 82% (averaging 35%).
- every project starting production later than the schedule guidance provided at FID.
No project met the hurdle rates that major European and US oil and gas companies currently expect. We estimate these projects will achieve Internal Rates of Return (IRR) of between 3.4% and 10.4%, with the Gorgon Project the only project to exceed 10%.
When looking at all Australian LNG facilities, including legacy projects, the growth wave, sanctioned projects, and projects that have not reached FID but are deemed financially viable by Rystad - Australia’s LNG industry has eroded $1.8 billion of shareholder value.
Despite being a top three global producer, Australia appears to be an outlier in terms of its lack of success generating value from LNG production. When modelled to 2100, based on the relationship between cumulative production and total NPV, the two largest LNG producers, Qatar and the United states, are each estimated to generate $80 billion in value, whilst Australia’s LNG sector appears to erode $1.8 billion.
Australia’s LNG growth wave appears to have eroded value despite coming online during what the IEA dubbed in 2011 as the “golden age of gas”, which saw Australian gas production triple in 12 years. However, the IEA now projects:
- gas demand to peak in every one of its scenarios by 2030
- Australian gas production reducing by 60% by 2050 if countries meet their climate targets.
The IEA now estimates that under current policy settings, the NPV of LNG plants under construction is over $300 billion. However, if the world achieves announced climate targets, two thirds of these facilities may not recover their capital costs.
The Australian LNG industry’s persistent record of exceeding FID capex and schedule slippages, combined with waning gas demand in an increasingly competitive global market, suggests that potential LNG backfills are not a reliable source of shareholder value.
2. Australia’s LNG industry
Since 2020, Australia has been the world’s largest LNG exporter. It has become so due to eight FIDs made between 2007 and 2012 that increased Australia’s LNG capacity from 20.6 Mtpa to 88.2 Mtpa.
Prior to the LNG growth wave, two projects were in operation - North West Shelf (NWS) and Darwin LNG (DLNG).
Project summary
Australia currently has ten operating LNG facilities.
Table 1 : Australia’s operating LNG facilities
| Facility | Location | Capacity (Mtpa) | Operator | FID | Start up |
|---|
| Legacy LNG projects | | | | | |
| North West Shelf (NWS) | Murujuga, WA | 16.9 | Woodside | 1985 | 1989 |
| Darwin LNG (DLNG) | Larrakia, NT | 3.7 | Santos | 2002 | 2006 |
| LNG growth wave | | | | | |
| Pluto | Murujuga, WA | 4.9 | Woodside | 2007 | 2012 |
| Gorgon | Barrow Island, WA | 15.6 | Chevron | 2009 | 2017 |
| Queensland Curtis LNG (QCLNG) | Bayali, Qld | 8.5 | BG, since acquired by Shell | 2010 | 2015 |
| Wheatstone | Nhuwala, WA | 8.9 | Chevron | 2011 | 2017 |
| Australia Pacific LNG (APLNG) | Bayali, Qld | 9 | Origin (upstream) & ConocoPhillips (downstream) | 2011 | 2016 |
| Gladstone LNG (GLNG) | Bayali, Qld | 7.8 | Santos | 2011 | 2016 |
| Prelude | Offshore WA | 3.6 | Shell | 2011 | 2019 |
| Ichthys | Larrakia, NT | 9.3 | Inpex | 2012 | 2018 |
No FID has been made for a new, standalone LNG facility in Australia since 2012. However, the Pluto project is currently under expansion, with a second train being built to process gas from the Scarborough field. Pluto 2 is operated by Woodside and has a capacity of 5 Mtpa. It reached FID in 2021 and is targeting first LNG in 2026.
3. Examining Australia’s LNG growth wave
Net present value - Australia’s LNG growth wave
Looking at the individual projects that made up Australia’s LNG growth wave, every one except Gorgon eroded value.
The losses for currently operating infrastructure total $31 billion (light blue bars in Figure 1).
When also factoring in the additional investments at these projects that have been sanctioned (dark blue bars in Figure 1), or that Rystad views as likely to be sanctioned (green bars), we find these additional investments generate $12 billion of NPV - which results in a net value erosion of $19 billion of shareholder value from Australia’s LNG growth wave.
Figure 1: NPV of Australia’s LNG growth wave ($ million)
Source: Rystad FCF raw data, ACCR analysis
Internal rate of return
We estimate that the projects in Australia’s LNG growth wave will achieve IRRs between 3.4% and 10.4%.
Current hurdle rates for a range of large European and US oil and gas companies show that contemporary hurdle rates for gas projects are between 11% and 30% (See Appendix 3 for references). As can be seen in Figure 2, none of these growth wave projects achieved an IRR within the range of contemporary hurdle rates.
Figure 2: Australian LNG growth wave project IRRs, relative to contemporary company hurdle rates (%)
Source: Rystad FCF raw data, ACCR analysis
Capex
The operators of the projects in Australia’s LNG growth wave provided guidance at FID that the total capex would be $173 billion. Total greenfields capex, according to Rystad’s raw data, was $234 billion, or 35% above the FID guidance.
The three Queensland LNG projects source gas, in part, from gas fields that were already operating prior to these LNG projects making FID. A total of $14 billion of brownfields capex was spent on these gas fields whilst these LNG projects were under construction - equivalent to an extra 8% of FID capex guidance for the LNG growth wave.
Figure 3 shows that greenfields capex on each project exceeded its FID capex guidance by between 2% and 82%. When adding brownfields capex, the projects all exceeded FID capex guidance by at least 32%.
Figure 3: Actual capex, relative to capex guidance at FID for Australia’s LNG growth wave
Source: FID guidance as per references above. Actual greenfields and brownfields capex raw data from Rystad
Several of these FID announcements gave assurances that price risk was adequately managed. Santos Ltd, for example, said that Gladstone LNG’s (GLNG) cost estimate “includes US$2 billion gross in contingencies” and is “predominantly fixed price EPC contracts”. GLNG’s final cost was 32% over the guidance issued at FID (or 16% if excluding brownfields capex).
When Australia Pacific LNG’s (APLNG) operator, Origin, announced the FID on the project’s second train it noted that:
- costs were still on track when measured in US dollars (as used in this report)
- the cost estimate included a $2.5 billion contingency
- cost increases at an adjacent facility were unlikely to happen to APLNG since the “cost estimates announced in July 2011 [at the time of the first train’s FID] already allowed headroom for cost increases of this type”.
Despite this, APLNG was delivered 40% over budget, when including the brownfields capex.
Although Rystads raw capex data is well above the guidance provided by the operators at FID, it is broadly consistent with other data sources, including contemporaneous media reports., Some operators also provided cost updates to the ASX. For example Woodside Petroleum provided updates that the cost of Pluto increased by: “6-10% over the [A]$11.2 billion” FID guidance in 2009; to A$14 billion in November 2010; and to A$14.9 billion in 2011.
Schedule
As well as being over budget, every project in Australia’s LNG growth wave started up later than FID guidance.
Table 2: Start up: FID guidance and actual
| Project | Start up: FID guidance | Start up: Actual |
|---|
| Pluto | 2010 | 2012 |
| Gorgon | 2014 | 2017 |
| QCLNG | 2014 | 2015 |
| GLNG | 2015 | 2016 |
| Prelude | 2017 | 2019 |
| APLNG | Train 1: mid 2015
Train 2: early 2016 | 2016 |
| Wheatstone | 2016 | 2017 |
| Ichthys | End of 2016 | 2018 |
At times, operators provided assurances that these projects would start up on time.
In 2013, Origin had ‘confidence in schedule and cost’ for APLNG, and actually accelerated train 2’s start up, so both trains would commence operation in 2015. APLNG did not start producing LNG until 2016.
In 2014, Santos’ then Managing Director, stated that; “We’re going to make first LNG [from GLNG] in the second half of next year… Nobody in this room should be in any doubt that that’s going to occur in 2015”. GLNG did not start producing LNG until 2016.
4. How do all Australian LNG facilities stack up?
Net present value - all Australian LNG facilities
When looking at the NPV for Australia’s legacy LNG projects, the foundation projects of North West Shelf (NWS) and Darwin LNG (DLNG) generated significant value, but Australia’s subsequent ‘LNG growth wave’ eroded a larger amount of value. In total, the portions of Australia’s LNG facilities that are already operating (light blue bars in Figure 4) have eroded $22 billion.
Sanctioned expansions, principally Ichthys backfill and Scarborough (dark blue bars in Figure 4), are estimated to generate $9 billion; with another $11 billion from further investments that Rystad’s raw data classifies as commercially viable, but have not yet reached FID, principally Gorgon backfill, Browse and Ichthys backfill (green bars in Figure4). Previous ACCR research determined that share buybacks represent greater value to Woodside shareholders than proceeding with Browse, so even though there appears to be some value from these additional investments, they may still not be the best use of scarce capital. The estimated financial impact of Australia’s LNG industry, including all previous and projected developments, is therefore an erosion of $1.8 billion.
Figure 4: NPV of Australian LNG projects - by FID date ($ million)
Source: Rystad FCF raw data, ACCR analysis
International comparison
Australia appears to be an outlier in terms of its lack of success generating value from LNG production. When modelled to 2100, the global LNG sector generates an estimated $300 billion of value across 33 countries. Qatar and the United States are each responsible for about $80 billion of value creation, with Mozambique and Indonesia also generating over $20 billion.
By contrast, Figure 5 shows that of the top ten LNG producers to 2100, only Malaysia and Australia have eroded value. Based on the relationship between cumulative production and total NPV, Australia would have been expected to generate $25.7 billion in value, but instead eroded $1.8 billion of value.
Figure 5: Relationship between total production and value generated by a country’s LNG sector
Source: Rystad FCF raw data, ACCR analysis
5. Lessons from the LNG growth wave
What went wrong?
Australia appears to be unusual in its LNG industry not generating value for shareholders. The key reason for this appears to be consistent capex overruns and schedule delays. There does not however appear to be a common underlying cause of these cost overruns. Table 3 lists some of the reasons provided for why these projects exceeded their budget.
Table 3: Disclosed reasons that projects exceeded their capex guidance
| Project | Reason that project exceeded capex guidance |
|---|
| Pluto | Needed to replace the flare and some of the insulation during commissioning. |
| Gorgon | Labour costs, poor productivity, logistics, bad weather and a rising Australian dollar. |
| QCLNG | As well as changes in exchange rates “... inflationary effects and the rising costs of local goods and services, costs of compliance with regulatory processes and some scope change” |
| GLNG | Increased the scope to accelerate capex in upstream gas fields in 2012. |
| Prelude | Used novel floating LNG technology that struggled to be implemented effectively. |
| APLNG | “...increased certainty around well and gathering locations for gas for Train 2, enabling more accurate cost estimates, changes to CSG [coal seam gas] water management scope to align with revised government policy, cost increases for third party LNG projects in which Australia Pacific LNG has an interest, and an increased allowance for project contingency”. |
| Wheatstone | Late delivery of liquefaction modules and underestimated quantity of materials needed to complete the project |
| Ichthys | The vessels arrived from the construction yards in South Korea late. Dangerous electrical work resulted in work being stopped by a regulator several times. Changes to scope for the onshore component led to billion-dollar contractual disputes. |
As well as cost increases during project execution, the lack of collaboration between operators appears to have resulted in suboptimal development concepts.
The three Queensland projects were constructed at the same time in the same region and by the same lead contractor, Bechtel. This created an unusual situation where the LNG companies were effectively competing with each other for contractor resources.
Wheatstone and Pluto are adjacent fields. That Wheatstone was not developed as an expansion of the Pluto project surprised analysts at the time. There are several reasons that processing the hydrocarbons from the Wheatstone reservoir at the Pluto LNG facility would likely have been lower cost:
- Pluto had nearly completed construction when Wheatstone reached FID, so the workforce could have completed Pluto 1 and then continued to expand the facility to process Wheatstone gas.
- Pluto already had environmental approval for a second LNG train and had “invested hundreds of millions of dollars” to prepare for additional production capacity.
- Pluto involves a 180 km pipeline to its onshore LNG facility, whilst Wheatstone constructed a 220 km pipeline to its new facility. Not only did Chevron decide to build an LNG facility further away than Pluto, but the pipelines actually cross, which would not happen if the reservoirs each took a direct route to their closest LNG facilities.
The Ichthys and Prelude reservoirs are reportedly connected to each other, meaning that either project can extract and sell the other’s hydrocarbons. If true, Prelude will likely have lost out, since it started up after Ichthys and did not reach stable operation for several more years.
In summary, Australian LNG operators have struggled to execute LNG projects. The diverse reasons that the operators of Australia’s LNG growth wave gave for the cost increases and schedule overruns means it is difficult to assess whether these problems have been addressed. Further value may have been eroded by operators not collaborating more with their peers.
Once operating, these LNG projects do produce strong cash flow, but this has not compensated for the significant capex overruns at the beginning of these projects. This has resulted in suboptimal returns for investors. This history should be considered when investors are assessing the viability of new Australian LNG projects such as Canning, Browse and the Beetaloo basin.
The LNG industry faces increasing challenges
Australia’s LNG growth wave was started up during what the International Energy Agency termed the ‘golden age of gas’. In 2011, the IEA posited that gas may be entering this golden age due to a number of factors, including a rapid increase in Asian gas demand.
In 2022, the IEA noted that actual Asian gas use in 2021 exceeded that projected in the golden age of gas report by 8%, confirming there really was a golden age of gas. For Australia, this saw gas production tripling from 53 bcm in 2010 to 154 bcm in 2022. However, this same 2022 report also noted that gas was now being outcompeted by wind and solar generation and policy support for gas ‘may be drawing to a close’. Under the Announced Pledges Scenario, where countries meet their current climate targets, Australian gas production will drop back to 60 bcm by 2050 - a drop of over 60%.
As the energy market continues to evolve, Australian gas exports will face different, and in some ways stiffer, competition. These challenges come from at least three interrelated issues:
- competition from renewable energy
- competition between LNG from Australia and LNG from other countries
- increasing policy measures to mitigate climate change.
Renewable energy is now much cheaper than fossil fuels - with analysts such as Lazard concluding that in some instances building new renewable facilities is cheaper than operating existing gas generators. This reduces the addressable market for gas in the electricity sector which is reflected in energy strategies of key LNG markets, such as Japan’s 6th Strategic Energy Plan, which sees a reduced role for gas by 2030. The previous Strategic Energy Plan had projected that LNG demand shrink from 37% of the energy mix in FY19 to 27% in FY30, whilst renewables increased from 18% to 22-24%. The 6th Strategic Energy Plan, sees the FY30 LNG target reduce to 20% and the renewables target increase to 36-38%.
The IEA’s scenario with the most gas use now projects gas use peaking before 2030, in large part due to the rapid growth of solar power.
Although Australia is currently the world’s largest LNG producer, Figure 6 shows that the United States and Qatar are developing projects that will see them overtake Australia. Qatar’s expansion is from its low cost and effectively limitless North Field gas reservoir.
Figure 6: Global LNG growth
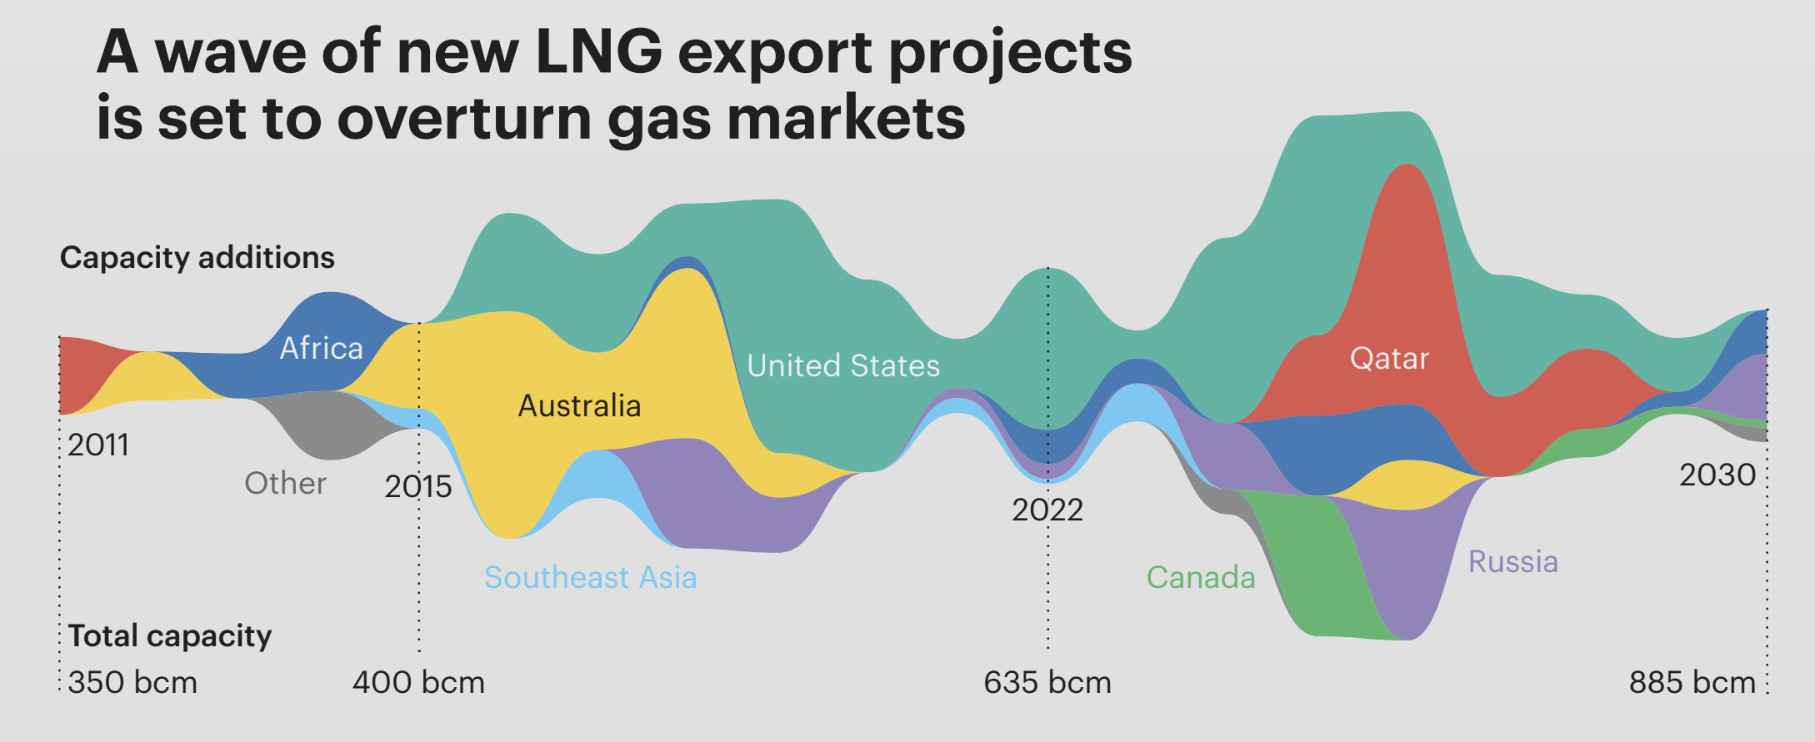
Both Qatar and the United States have a cost advantage that Australian projects will need to overcome as they compete for global capital. The IEA estimates that, under current policy settings (its Stated Energy Policy Scenario), the NPV of LNG plants currently under construction is over $300 billion with 170 bcm of new capacity expected to come online between 2025 and 2027. If the world achieves announced climate targets (the IEA’s Announced Pledges Scenario), two thirds of these facilities may not recover their capital costs.
Climate arguments against new gas developments are coming from increasingly influential stakeholders. The United Nations and International Energy Agency both now argue that developing new gas fields is counter to climate change mitigation efforts.
It is still possible to avoid the very worst of climate change, but only with dramatic, immediate climate action. The solution is clear: end licensing or funding of new oil and gas, stopping expansion of existing oil and gas reserves.
Antonio Guterres, UN Secretary General, 2023
As clean energy expands and fossil fuel demand declines in the NZE [Net Zero Emission] Scenario, there is no need for investment in new coal, oil and natural gas
Net Zero Roadmap, A Global Pathway to Keep the 1.5°C Goal in Reach, 2023, p16
Global fossil fuel production must start declining immediately and steeply to be consistent with limiting long-term warming to 1.5°C.
The Production Gap, 2021 Report
The inherent complexity of developing LNG ‘megaprojects’
Oil and gas developments are inherently complex. Data from Independent Project Analysis (IPA) shows that non-oil and gas ‘megaprojects’ have a success rate of approximately 50%, compared to a success rate of only 22% for oil and gas megaprojects. Two thirds of the failed oil and gas megaprojects produced less than half the planned production rates during the first two years of operation.
This is partly because the size and specificity of oil and gas megaprojects make it difficult to learn from one megaproject to improve on the next. Each oil and gas development requires a bespoke design to account for the reservoir characteristics, fluid compositions, proximity to market, etc. An oil and gas megaproject may take a decade from concept to startup, so few people have worked on more than two from start to finish; the majority will never experience a full megaproject project lifecycle.
A particular characteristic of oil and gas development is the requirement for significant skills integration - reservoir, drilling, completions, wells, subsea hardware and facilities engineers are each themselves subdivided into specialty disciplines, with the number of interfaces growing with project complexity.
Scale and large investment is often conflated with success
The scale of Australia’s LNG growth wave has been highly lauded by the LNG industry and successive Australian state and Commonwealth governments.
The rapid development of Queensland’s LNG industries has generated wealth, boosted tax revenues and delivered high paying jobs to the State.
Australian Petroleum Production & Exploration Association (APPEA), 2021
In recent years, the east coast gas market has… [given] birth to the largest liquefied natural gas export industry in the world in a few short years. This was an extraordinary success story…
Angus Taylor, Former Climate Change Minister, 2020
Japanese and South Korean demand, and their significant capital investment, has underpinned the development of Australia’s LNG industry and most Australian gas production for the benefit of Australian industry and consumers.
Madeleine King, Minister for Resources, 2021
Market analysts have pointed to the globally significant levels of investment as a measure of its success.
A successful upstream oil and gas regime is one most appropriately defined as consistently attracting substantial levels of investment. Oil and gas is a global and capital-intensive business and companies typically have significant optionality in their upstream portfolios as to where and when they invest. Australia’s success can be demonstrated by the fact that its oil and gas industry has enjoyed a globally significant investment boom over the last decade, headlined by a US$200 billion (A$305 billion) wave of liquefied natural gas (LNG) megaprojects which set the country on course to become the world’s top LNG exporter.
Wood Mackenzie, 2020
However, this “success story” has not gone entirely unchallenged. In 2016, for example, then chief executive of Woodside Petroleum, Peter Coleman, said that the LNG industry had been “out to lunch”, with projects running over budget and behind schedule.
Whilst we may wax lyrical about the $200 billion [in investment], it actually started as $100 billion … We didn't deliver on our promise. We delivered a very expensive energy source.
Peter Coleman, chief executive, Woodside Petroleum
6. Will LNG backfills recover some of the losses?
Many of Australia’s LNG facilities have, or will soon have, spare capacity that could be used to process additional ‘backfill’ gas supplies. The analysis in section 4 assumes these investments will be delivered in accordance with Rystad’s cost and schedule estimates. Whether these investments generate shareholder value will depend, in part, on their actual cost and schedule.
It is worth noting that the projects that made up Australia’s LNG growth wave would also have been attractive projects when they made FID. History shows however that the guidance issued at FID underestimated both the delivered cost and the schedule of these projects and that, as a whole, they do not appear to have created value. Australia’s LNG growth wave projects exceeded FID capex guidance by an average of 35% and none started in the year that they were originally expected to.
Figure 7 shows a nearly linear relationship between capex costs and the NPV of Australia’s unsanctioned LNG projects, with a 35% increase in costs reducing the estimated NPV of this portfolio by about half.
As well as being over budget, all Australian LNG growth wave projects started up late. Any delay in startup for any future LNG projects or backfills would further reduce their value.
As such, it is uncertain whether these backfill opportunities will create value. Whilst some appear to based on current projections, historic cost and schedule slippages would see many of them cease to be attractive. As such, ACCR does not view these options as reliable sources of shareholder value.
In addition, previous analysis by ACCR has shown that even if a project delivers some value, share buybacks may still create more value.
Figure 7: Relationship between capex increases and NPV for Australia’s unsanctioned LNG projects
Source: ACCR analysis using Rystad’s raw data and economic model
Appendix 1 - sources, methodology and terminology
Most production and financial data have been sourced from Rystad Energy’s UCube, release date 4 July 2023. Rystad Energy has only delivered asset level data and the model used to calculate the capex sensitivity in section 6. Rystad is not responsible for any conclusions drawn from the data. ACCR retains responsibility for any subsequent assumptions or errors.
Rystad data is regularly updated to reflect actual historical data, including on production and cost. Future prices work towards a long term $60/bbl Brent price (RT2023). The FCF data are post tax, incorporating Petroleum Resources Rent Tax and company tax. The Safeguard Mechanism has not been modelled, but this is not expected to have a material impact on the results.
Rystad’s raw data classifies each LNG “project” (e.g. Pluto LNG) as a set of “assets” (e.g. Xena, which is a gas field that supplies Pluto LNG). Each asset has its own FID date - so projects include assets with different FID dates, requiring an assumption to be made about how to calculate a single NPV of a project. Unless otherwise stated, the NPV calculations in this report discount the FCF of each asset to the FID date for that asset. The project level NPVs are the sum of the asset NPVs and they have not been adjusted for inflation. Appendix 2 assesses an alternative approach.
We have used a discount rate of 10%. This is Rystad’s default assumption and similar to the discount rates we recently calculated for Woodside’s Australian LNG projects, which in turn are based on the Independent Expert Report into the merger of Woodside and BHP Petroleum.
IRRs are based on the sum of the FCF of all assets in a project, from the year the main LNG project took FID. For the Queensland LNG facilities, this includes the FCF for gas fields that were already operating prior to FID, but saw additional investment so that they could supply the quantities required for the new LNG facilities.
Capital costs are expressed in nominal terms. For the Queensland LNG facilities that connected existing gas fields to new LNG facilities, a distinction is drawn between greenfields capex and brownfields capex, since it is not clear how much of this brownfields capex was required to supply the LNG facilities and how much would have been required to maintain domestic gas production.
Currencies are in US dollars, unless otherwise stated.
Appendix 2 - sensitivity to discount methodology
As discussed in Appendix 1, the NPVs in this report could be calculated in a number of different ways. The method used treats every asset within each LNG project distinctly, and then sums them without further accounting for a cost of capital or inflation.
An alternative method would be to take the major FID date as the base year for each asset within a project. This will change the NPVs for a number of reasons including:
- It captures pre-FID expenses for assets that made FID later (e.g. Xena’s exploration costs between Pluto LNGs FID in 2007 and Xena’s FID in 2013)
- It will further discount projects with later FIDs. This has a more significant impact on projects that are currently under construction, or yet to be sanctioned, which are all modelled to be value accretive.
The most dramatic example of how much this can change the NPV is for Scarborough. Woodside’s then CEO, Don Volte, made this clear: "we do not see Pluto as a one-train development… We have invested hundreds of millions of dollars to make a bigger pipeline coming onshore, to build additional infrastructure on the platform. We've built most of the infrastructure for two to three trains."
If Scarborough is treated as an extension of Pluto, then costs incurred between Pluto’s 2007 FID and Scarborough’s 2021 FID should be incorporated in the project economics. At over $550 million (nominal), the pre-FID costs for Scarborough are material. Treating Scarborough’s based year as 2007, also discounts Scarborough’s free cash flow by an additional 14 years. Combining these two effects reduces the NPV of Scarborough by 80% from $2.1 billion (RT 2021) to $431 million (RT 2007). Part of this reduction is due to inflation, but adjusting both values to 2023 dollars using a 2.5% annual inflation still results in a 70% NPV reduction.
Applying a single FID date to each asset within a LNG project and adjusting for a notional 2.5% pa inflation would result in a larger estimate of value erosion from Australia’s LNG sector. It would see $42 billion (RT2023) of value eroded, compared to the $19 billion estimate used in the bulk of this report. Figure 8 shows this on a project by project basis.
Figure 8: NPV of Australia’s LNG growth wave assuming a single FID date per project ($ million, RT23)
Source: Rystad FCF raw data, ACCR analysis
Appendix 3 - contemporary company hurdle rates
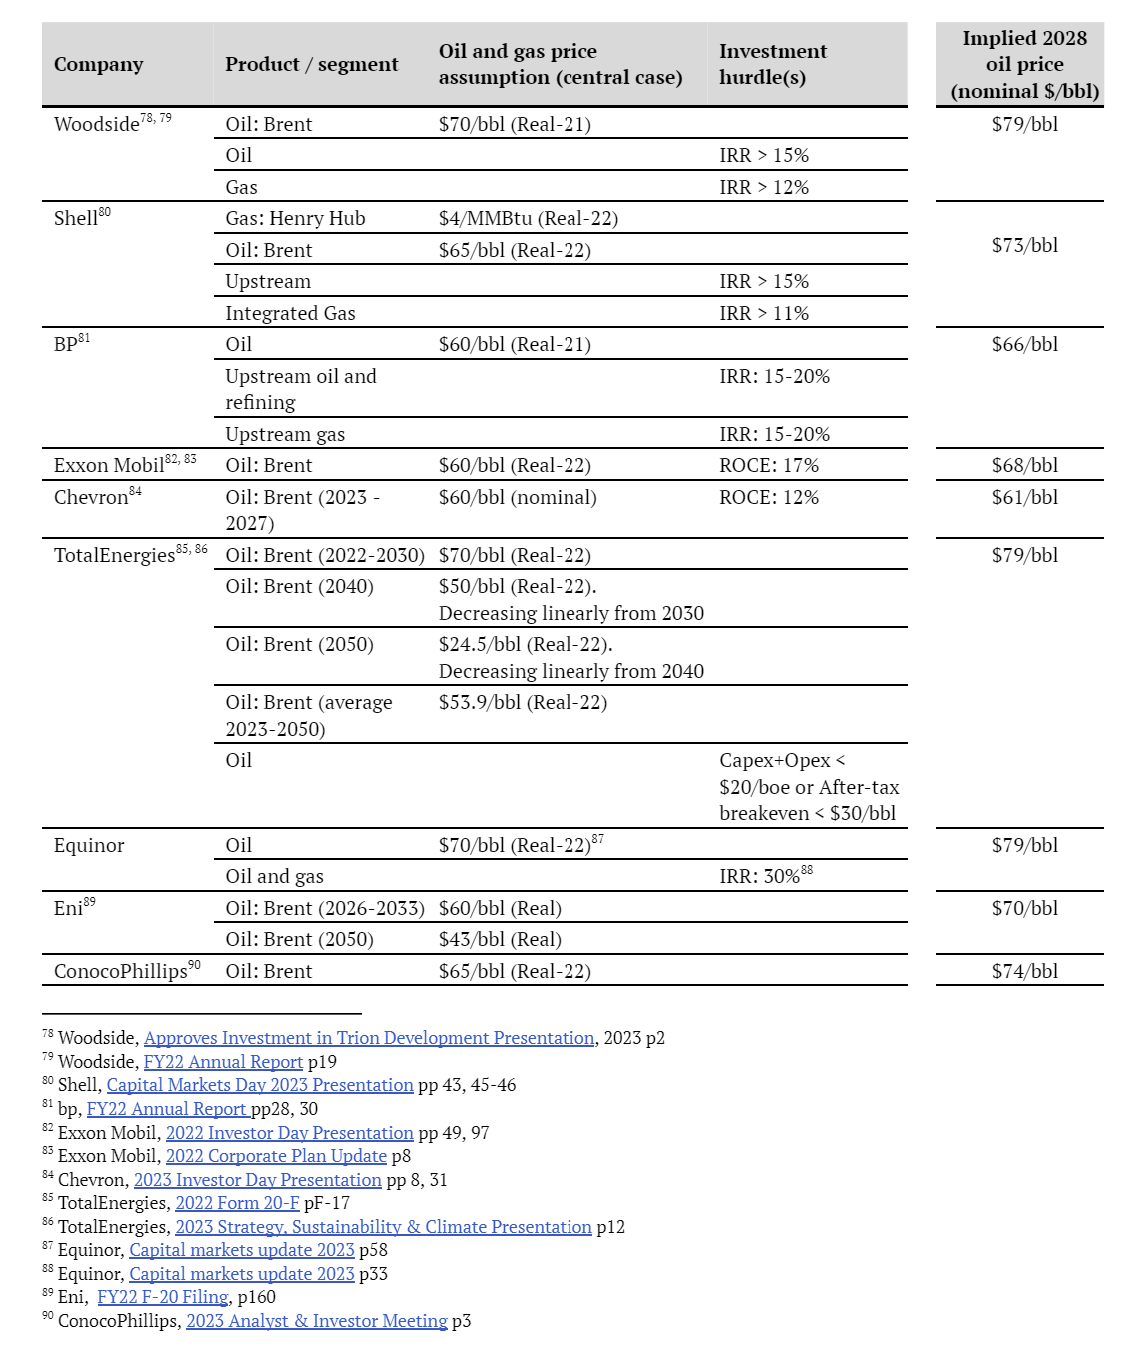
Table footnotes: ,,,,,,,,,,,,.
Download Australia's LNG growth wave - did it wash for shareholders? | 27/11/2023
Please read the terms and conditions attached to the use of this site.