27th October 2023
Publication Information
Download Publication
- 373 KB PDF
- 27th October 2023
Stay Informed
Get email updates about new ACCR research and shareholder advocacy on specific topics of interest to you.
Sign UpThe International Energy Agency (IEA) this week released its 2023 World Energy Outlook (WEO), with coal, oil and gas all projected to enter terminal decline before 2030 under all IEA scenarios. Future profitability of LNG looks to be in question, with a forecast glut on the near horizon. The big surprise is China emerging as a key driver of the global energy transition - while it’s been the major source of global emissions over the last decade, China is now deploying over half the world's renewable energy and EVs, and with its economy at an inflection point, fossil fuel demand is set to decline.
The focus of this WEO is the Stated Energy Policy Scenario (STEPS), based on implemented climate policies, and the Announced Policy Scenario (APS), based on announced climate targets. Alarmingly, the 2023 STEPS is showing a global temperature outcome of 2.4°C - an outcome scientific consensus regards as an existential threat to humanity. Already, at more than 1.2°C warming above pre-industrial levels, scientists are surprised[1] by the rapid onset and severity of extreme climate-related weather, and the imminence of tipping points: melting of the West Antarctic ice-shelf may already be irreversible.[2]
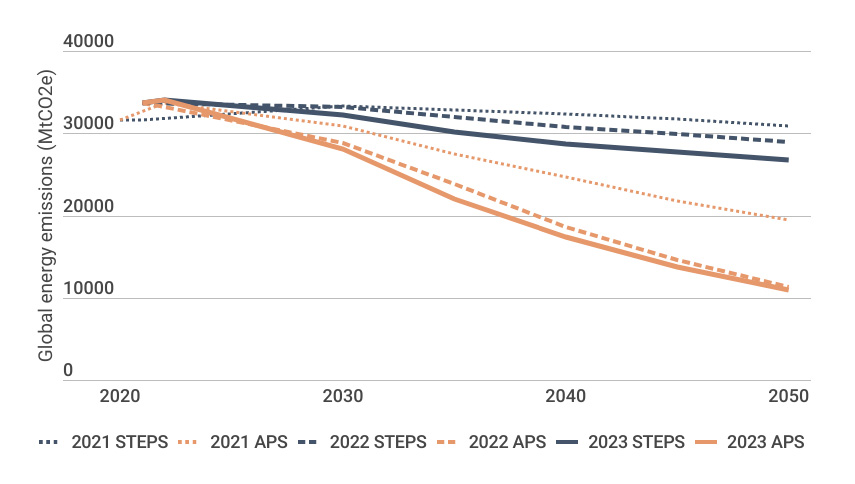
However, neither STEPS nor APS is a bankable forecast for investors. They are scenarios under the Paris Agreement, tracking the ratcheting up of ambition on climate targets (APS) and implementation of climate policies (STEPS). As Chart 1 below shows, there has been a marked increase in global ambition since the 2021 WEO, and a smaller but still steady increase in policy implementation, resulting in anticipated emissions from global fossil fuel use trending further down. While the level of policy implementation so far has not been sufficient - as evidenced by the STEPS 2.4°C outcome - investors should expect and prepare for both ambition and policy implementation to increase and the downward trend on emissions to continue. As the energy transition gathers pace and the climate crisis bites, targets and policies will move faster.
The economic benefits of taking urgent steps to reduce emissions are becoming increasingly clear. This week, Lloyd’s of London data[3] showed that the global financial cost of extreme weather events, measured over five years, could be between $3 trillion to $17 trillion - compared to the cumulative investment needed to deliver a Paris-aligned energy system, which is $5.9 trillion by 2030, and $16.7 trillion by 2037.[4]
Despite the pressing need for more action, there are already notable shifts occurring under the present policy landscape. In fact, the sectors that consume the most coal (steel, cement and power generation), oil (internal combustion vehicles) and gas (power generation and space heating) have all passed the peak of their capacity additions.
Consumption of coal, oil and gas will all peak prior to 2030 in all IEA scenarios.
Under the highest emissions scenario, STEPS:
Demand for, and investment in, each fossil fuel declines faster in the APS and faster again in the NZE.
The chart below shows the global temperature implications of the current gap between STEPS and NZE.
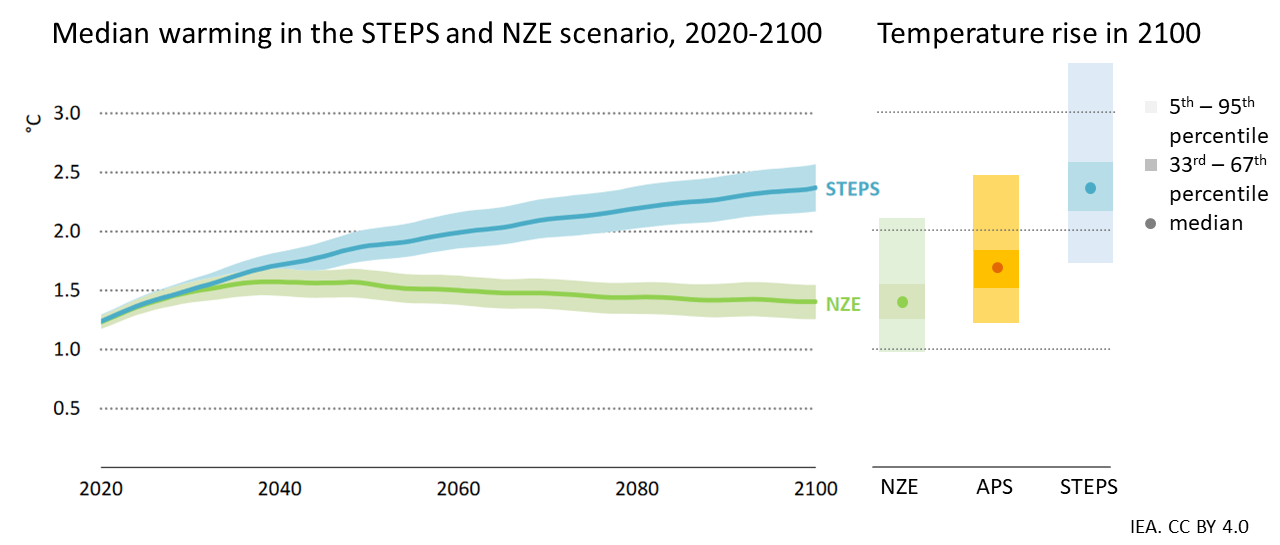
Left: from IEA, 2023, Net Zero Roadmap (figure 2.3). Shaded area represents the 33-67% confidence interval. Solid line represents median warming. Right: from IEA, 2023, WEO (amended from figure 4.1)
To reach NZE, we need to accelerate our ambition. We need more government support, stronger policies and more collaboration between nations, companies and investors.
Over the past decade, China has driven global energy trends, accounting for two-thirds of oil consumption growth, a third of natural gas growth, and nearly all coal consumption growth. However, China's economy is at an inflection point.
High debt, a peaking construction sector and declining working-age population, indicates that China's energy-intensive sectors are poised for a decline. Whilst China’s energy demand is tapering, its commitment to clean energy remains robust - China led in global wind and solar additions and EV sales. China's fossil fuel demand will likely peak this decade, offsetting potential demand rises in emerging markets, such as India.
China has contracted to purchase 80bcm more LNG than it needs in 2030 under the APS - equivalent to a third of its contracted portfolio. This would create an unusual situation where China may be simultaneously importing gas and competing with gas exporters as it tries to redirect contracted cargos. If this eventuates it is likely to further depress prices and saturate the LNG market. Our view is that if China continues to increase domestic gas production, this may further reduce gas imports.
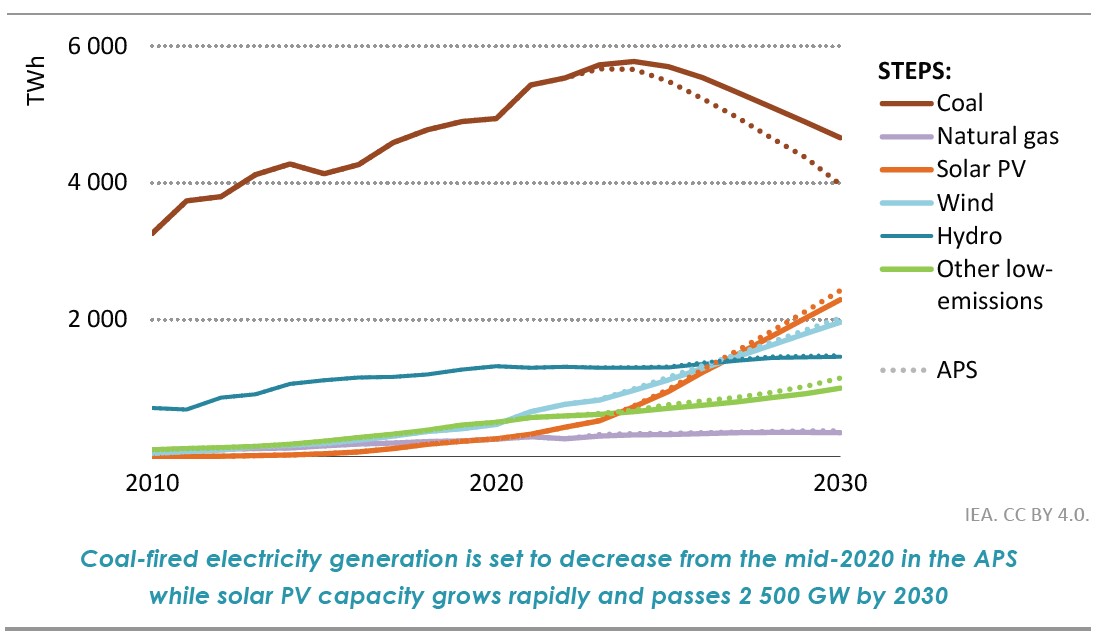
From IEA, 2023, WEO, figure 5.21
China's coal power is expected to start rapidly declining before 2030, shifting towards renewables with an installed capacity of 5,400 GW of solar PV by 2030 in APS. Previous claims that gas is needed to displace coal seem to be unfounded - with effectively all Chinese coal power reductions being due to increased renewables in the STEPS, and additional efficiency measures in the APS. This contributes to the substantial LNG surplus in APS.
This is key to reducing global CO2 emissions, with China's coal emissions expected to drop from 8.6 GtCO2e in 2022 to 1.1 GtCO2e in 2050 in the APS, accounting for 30% of the global CO2 reduction target in this scenario.
Despite China's ongoing expansion of coal power capacity, its current fleet currently operates at about 50% capacity, down from 81% in 2007. With expected declines to 40% and 35% by 2030 in STEPS and APS scenarios, respectively, new capacity is not expected to supply bulk energy, but rather to provide flexibility in the grid.
Investment in clean energy has outstripped investment in fossil fuels since 2016. In 2023, clean energy investment exceeded fossil fuel investment by 80%, with the gap expected to increase.
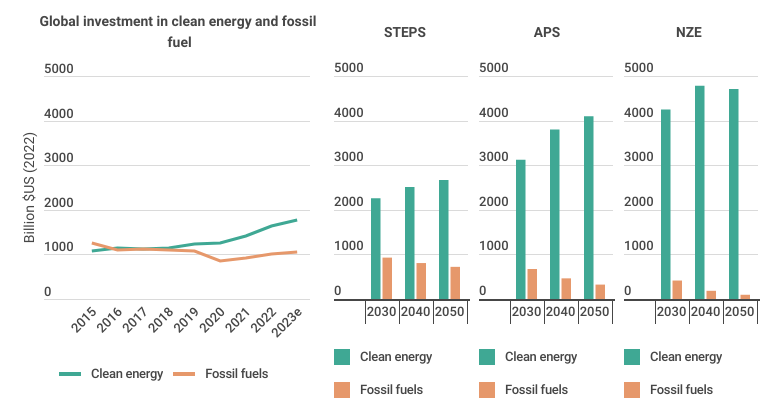
All IEA scenarios see a decline in fossil fuel capital expenditure from today’s levels. And compared to previous STEPS scenarios, projected fossil fuel capital expenditure is lower in the current STEPS scenario.
From IEA, 2023, WEO, figure 1.35
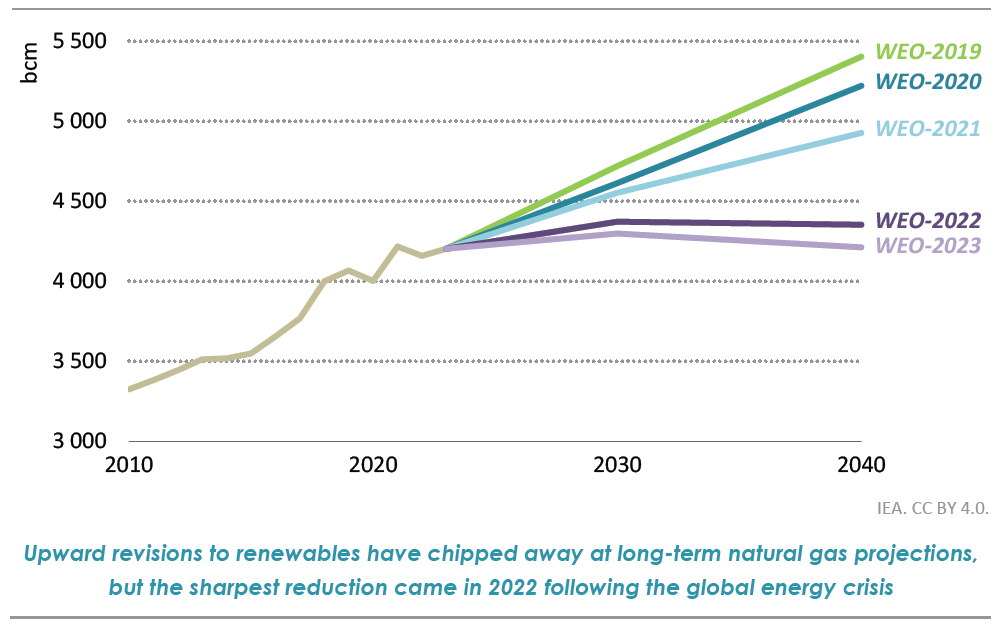
Before WEO 2022, STEPS predicted strong global natural gas growth. Events in 2022, including the Russian invasion of Ukraine, prompted a significant revision in natural gas outlook.
WEO 2023 projects a 140 bcm reduction in 2040 natural gas demand, largely due to rising renewable expectations. This is equivalent to all of Russia’s gas exports prior to 2019. Advanced economies, especially Europe, drive most of this decrease.
LNG glut poses risk to sector’s profitability
From 2022 to 2030, global gas trade in the STEPS scenario increases by 15%, surpassing overall gas demand growth. This growth is primarily due to LNG, which increases by 130bcm, resulting in LNG making up 66% of global gas trade in 2030.
The LNG industry is currently constructing 250 bcm of new capacity - mostly in Qatar and the US. This exceeds the projected increase in LNG consumption, resulting in an LNG ‘glut’ even in the highest emissions scenario, STEPS. This will put downward pressure on prices and reduce profitability of the whole sector.
Download Investor Bulletin: IEA’s 2023 World Energy Outlook | 27/10/23
https://academic.oup.com/bioscience/advance-article/doi/10.1093/biosci/biad080/7319571?login=false ↩︎
https://www.lloyds.com/about-lloyds/media-centre/press-releases/lloyds-new-data-tool-highlights-vulnerability-of-the-global-economy-to-extreme-weather ↩︎
Source: World energy outlook 2023, based on cumulative additional investment in NZE scenario vs STEPS scenario ↩︎
Get email updates about new ACCR research and shareholder advocacy on specific topics of interest to you.
Sign Up