15th August 2023
Publication Information
Download Publication
- 2 MB PDF
- 15th August 2023
Stay Informed
Get email updates about new ACCR research and shareholder advocacy on specific topics of interest to you.
Sign UpThere is not a continent on the planet that has not seen record breaking extreme weather in 2023.[1] China set a new national temperature record of 52.2°C; Antarctica saw record low ice levels; record-breaking monsoon rains in South Asia brought deadly floods to north India and Pakistan; a relentless heatwave in the United States put more than 100 million people under excessive-heat advisories; an intense heatwave in southern Europe led to a sharp rise in hospitalisations; smoke from prolonged wildfires in Canada blanketed large parts of two countries; and temperatures soared above 30°C in Argentina and Chile in the middle of winter. July was Earth’s hottest week on record, with temperatures once deemed statistically implausible.
While extreme weather comes and goes - and with it the media attention - the underlying changes in climate processes do not. Changes to climate processes like the ocean circulation, El Niño and La Niña, and the jetstreams are irreversible, will drive more extreme weather, and have large consequences for the livability of the planet.
The financial industry is not immune from the physical risks of escalating temperatures. As head of government engagement and sustainability at Aviva said recently: “[Aviva is] not going to survive on a 3C or 4C planet.”[2] We have seen recent warnings that many climate-scenario models commonly used to stress test portfolios under different warming pathways are significantly underestimating the risks of temperature rises, leading some institutions to conclude that high warming scenarios will have minimal implications for portfolio returns.[3] The same research raises the prospect that carbon budgets may be smaller than anticipated,[4] with “more severe, acute physical risks” developing more quickly than we thought.
Investors are facing a moment of reckoning: protecting long-term value across diversified portfolios requires urgent, science-based, forceful stewardship aimed at accelerating decarbonisation and reducing real world emissions.
The warming of oceans has been relentless for decades, with some of the most recent observations of reduction of sea-ice extent[5] and extreme ocean temperatures[6] so unprecedented (38.4°C ocean temperature off the coast of Florida)[7] that they are yet to be scientifically explained.
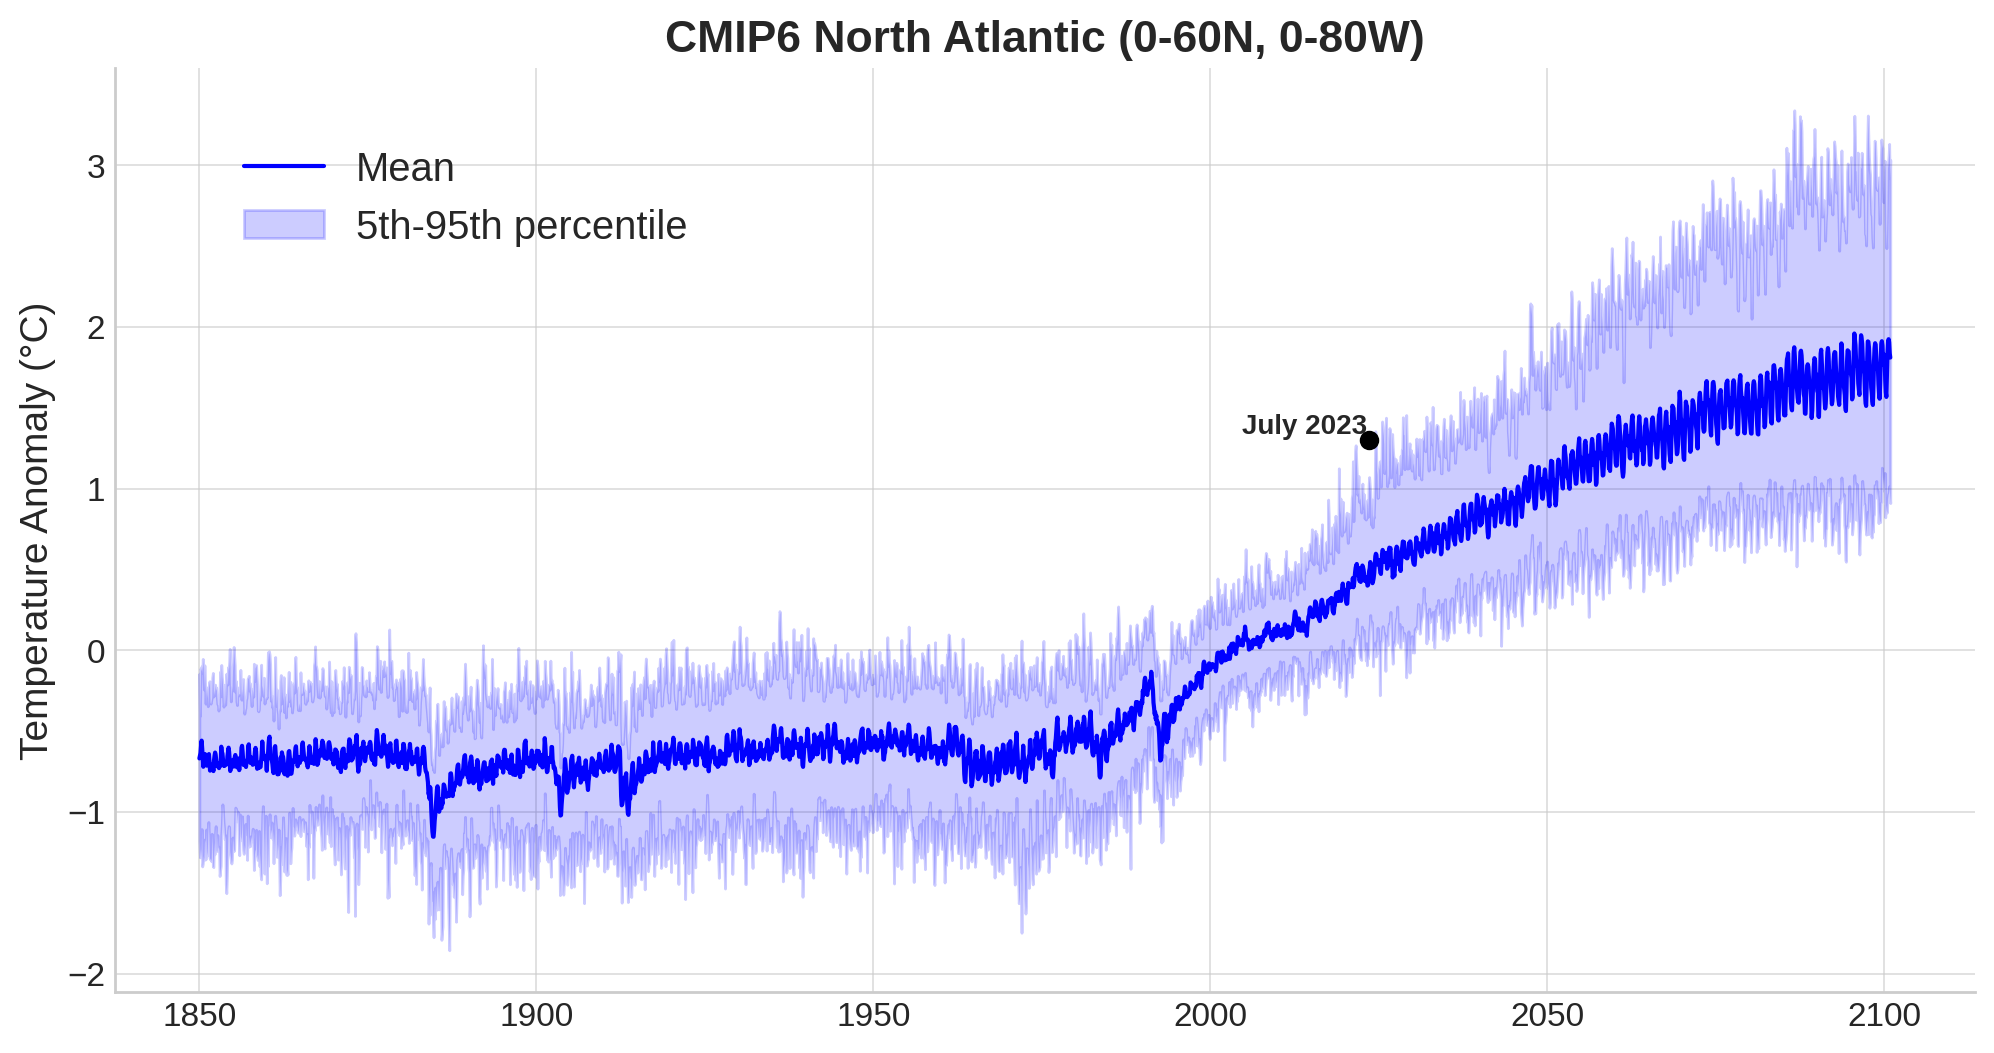
Monthly mean ocean surface temperature in the North Atlantic modelled by 40 most recent climate models with a temperature outcome of ~2.5-2.7°C in 2100. The recorded temperature in July 2023 is outside of the 5th-95th percentile range across all the models. Image credit: Zeke Hausfather, theclimatebrink (link)
However, the consequences of any single, extreme event are dwarfed by those of the fundamental changes occuring in ocean processes. There is increasing evidence that the global ocean conveyor belt, a constantly moving system of deep ocean water around the globe, is changing in response to climate change.[8] The Southern ocean system (Southern Ocean overturning circulation) around Antarctica has weakened by 40% since 1991 and is forecast to weaken by another 40% by 2050.[9] The Atlantic Ocean system (Atlantic Meridional Overturning Circulation, AMOC) has also weakened over the last century, and is modelled to weaken further, reaching a tipping point around 2050 (95% uncertainty range 2025-2095), which would see a collapse of this system.[10],[11]
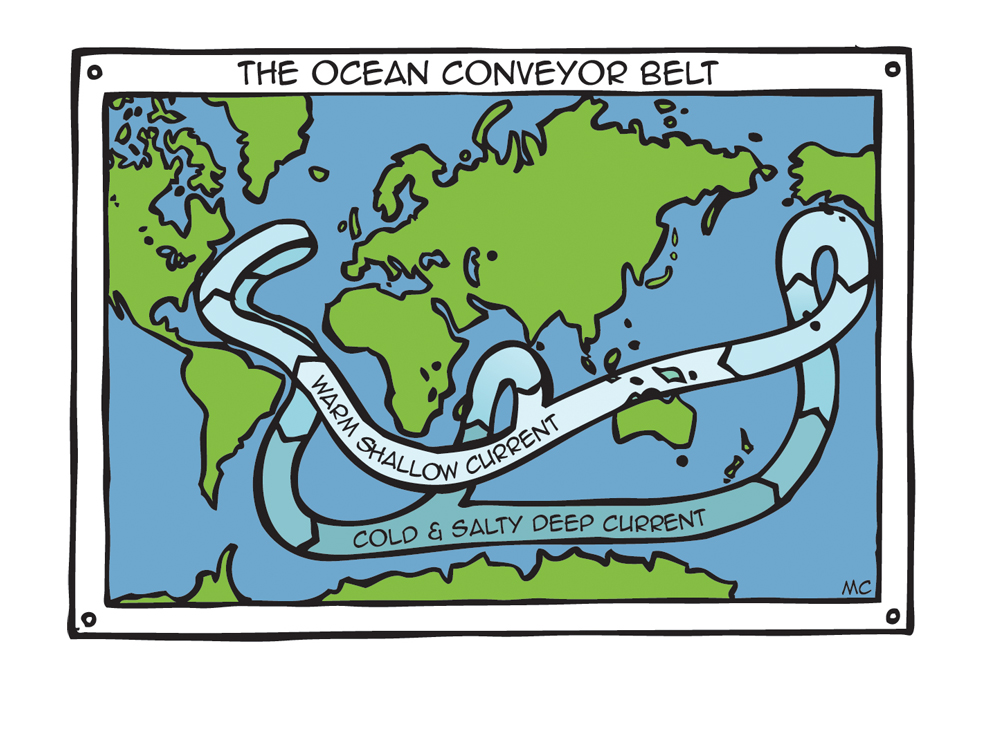
A parcel of water takes between 500 and 2000 years to complete a trip around the earth. Image credit: National Geographic/Mary Crooks
The global ocean conveyor belt is weakening due to warming air and ocean temperatures escalating ice melts on Greenland and Antarctica. The melting ice dumps fresh water in the ocean that is less dense than the salty water in the ocean, which makes it harder for that water to sink to the bottom in the Arctic and around Antarctica, slowing down the circulation system.
Ocean circulation is crucial for transporting nutrients, oxygen and carbon flows around the globe, and further weakening of the AMOC could start depleting fisheries within decades.[12] It also plays a critical role in redistributing heat and regulating weather patterns. The weakening of the AMOC may have already brought cooler temperatures to high latitude countries around the Atlantic and influenced the generation of heat waves in Europe.[13] Further weakening could have dramatic global consequences on weather patterns, including, but not limited to, reduced rainfall in Africa’s Sahel region, hampering crop production; more winter storms in Europe; and regional sea-level rise around the Atlantic.[14]
The AMOC is now weaker than at any point in the last millennium.[15] Scientists agree it has a tipping point - a threshold where it grinds to a halt, i.e. complete collapse - and that this would be catastrophic, leading to drought, crop failures, storms and rising sea levels impacting billions of people. Less certain, though, is the timing. One recent paper estimated collapse will occur around mid-century under the current scenario of future emissions.[16] Other analysis points to the risk being “far greater than 10 % during this century – even rather worrying for the next few decades.” [17]
There is strong evidence that the next El Niño is currently developing and will eventuate towards the end of 2023, or start of 2024.[18] While historical evidence does not point towards this being an extreme El Niño,[19] the accumulation of the natural carbon stocks (the green growth) thanks to three La Niña phases in a row, raises the risk of severe wildfires, globally. A lot of the variation in rainfall in Australia is tied to the phase of the ENSO and the developing El Niño is setting Australia up for a hotter and drier summer.
The character of the two El Niño-Southern Oscillation (ENSO) phases - El Niño and La Niña - has become more severe over the last sixty years, with more frequent and strong El Niño and La Niña events. Research suggests that climate change is having an effect on ENSO variability.[20]
A normal El Niño phase can add 0.2°C to global temperature,[21] potentially increasing the global temperature for 2023 to 1.5°C above pre-industrial levels, and pushing certain areas above 1.5°C. While the weather feels extreme now (at 1.2-1.3°C long-term average above pre-industrial levels) it will become the norm with each additional temperature increase. If the world heats up by 2°C, the kind of extreme heat waves we’ve seen over 2023 will happen every two to five years.[22]
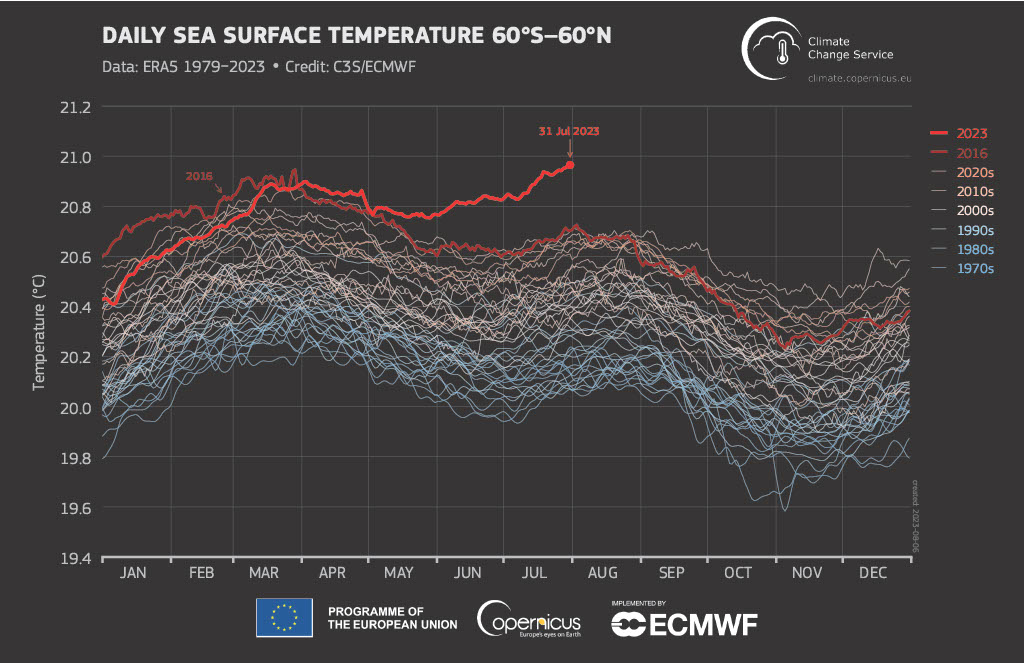
Daily global sea surface temperature (excluding the polar regions) between 1979-2023 highlighting the 2023 extreme ocean temperatures. Data: ERA5. Credit: C3S (Copernicus Climate Change Service)/ECMWF [23]
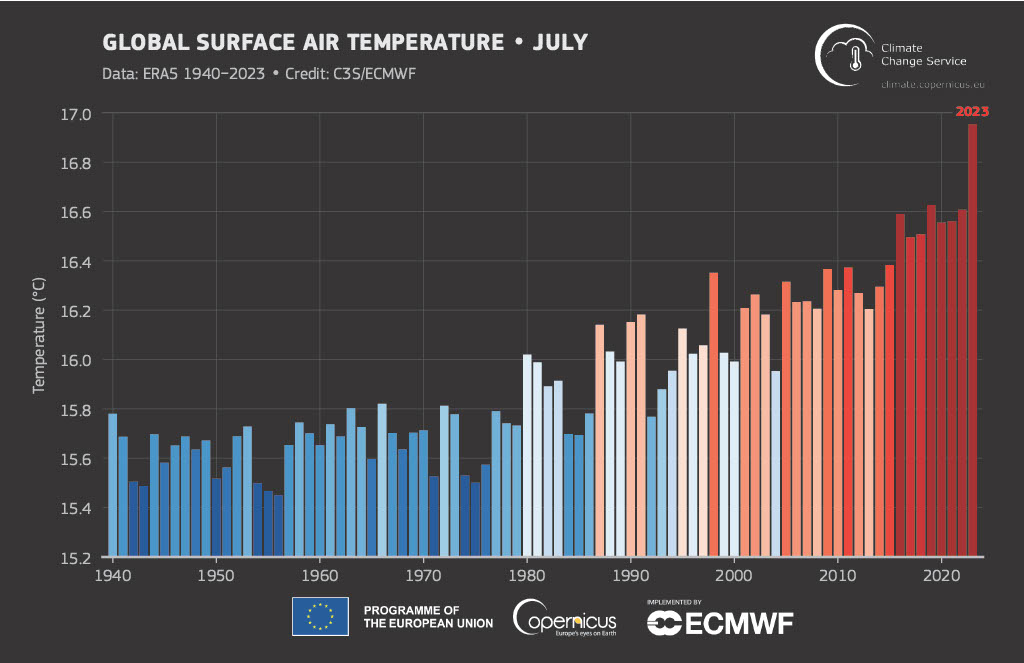
Monthly global surface air temperature for the month July between 1940-2023. July 2023 is 1.5°C warmer than the average for 1980-1900. Data: ERA5. Credit: C3S (Copernicus Climate Change Service)/ECMWF [24]
Jetstreams are fast flowing, narrow bands of wind that generally blow from west to east across the globe. The southern hemisphere jetstream plays an important role in the weather patterns over Australia and New Zealand; rainfall in south-east Australia is influenced by the location of the jetstream. The jetstreams in both hemispheres have shifted polewards. In the southern hemisphere, the jetstream has moved southwards bringing less autumn rain over South-east Australia.[25]
The Northern hemisphere, the winter jet stream has moved more than 300 kilometres northward over the Atlantic,[26] as a consequence of the warming Arctic. This shift has increased the wind speed, influencing storm activity and temperature distribution in the Northern hemisphere. The shift also has less obvious economical implications: e.g. increased fuel use and decreased energy efficiency for long-haul aviation.[27]
A live scientific debate is underway about the relationship between these changes to the jetstreams and ‘blocking’ events. (CarbonBrief has done an excellent piece analysing this debate.) Blocking events occur when a stationary and persistent weather pattern, usually a high-pressure system, gets stuck in position and blocks an approaching jetstream. A blocking event has the effect of “locking in” a weather pattern, like a persistent dry spell or an extreme heat wave. Blocking events have been responsible for string of extreme heat waves, including:
Atmospheric waves called ‘Rossby waves’ that occur in the jetstreams are thought to be crucial to the development of blocking events. Recent research shows a link between the changing jetstream and an increase in blocking high pressure systems (at least over Europe).[37] Research also suggests that blocking events are likely to increase in size,[38] and may become more frequent[39] in the Arctic, due to the region's rapid warming. This potentially creates a positive feedback loop, whereby extreme warm conditions persist for longer periods of time, causing more melting. However, it’s difficult to model what the impact will be of future accelerated global warming, as climate models do not do a great job simulating blocking events.
2023 is on target to become the hottest year on record.[40] While the IPCC’s latest synthesis report (March 2023) clearly states that the window of opportunity to secure a livable and sustainable future for all is rapidly closing,[41] we need to confront the possibility that this window may be much smaller than we previously thought: as I covered in my last Climate Science Insight the Earth has already passed the safe and just threshold of seven of the eight Earth system boundaries. Further changes to fundamental climate processes will take us into territory where the extremes of 2023 may end up seeming mild. There is no other course of action than accelerated decarbonisation.
Dr Dimitri Lafleur, ACCR Chief Scientist
Climate Science Insight: Irreversible change | 15/08/23
Please read the terms and conditions attached to the use of this site.
CarbonBrief, 2023, Media reaction: Extreme weather hits world’s seven continents in July 2023 ↩︎
Portfolio adviser, 2023, Financial industry ‘completely underestimating’ physical risks from climate change ↩︎
Trust, S., Joshi, S., Lenton, T. and Oliver, J., 2023, The Emperor’s New Climate Scenarios ↩︎
Forster, P. M., et al., Indicators of Global Climate Change 2022: annual update of large-scale indicators of the state of the climate system and human influence, Earth Syst. Sci. Data, 15, 2295–2327, https://doi.org/10.5194/essd-15-2295-2023, 2023 ↩︎
Labe, Z., 2023, Antarctic: Sea-ice concentration/extent/thickness ↩︎
The Washington Post, 2023, Ocean temperatures are off the charts. Here’s where they’re highest ↩︎
24th of July, real time data file: https://www.ndbc.noaa.gov/data/realtime2/MNBF1.ocean ↩︎
Lee, SK., Lumpkin, R., Gomez, F. et al. Human-induced changes in the global meridional overturning circulation are emerging from the Southern Ocean. Commun Earth Environ 4, 69 (2023). https://doi.org/10.1038/s43247-023-00727-3 ↩︎
Li, Q., England, M.H., Hogg, A.M. et al. Abyssal ocean overturning slowdown and warming driven by Antarctic meltwater. Nature 615, 841–847 (2023). https://doi.org/10.1038/s41586-023-05762-w ↩︎
Qasmi, S.: Past and future response of the North Atlantic warming hole to anthropogenic forcing, Earth Syst. Dynam., 14, 685–695, https://doi.org/10.5194/esd-14-685-2023, 2023 ↩︎
Ditlevsen, P., Ditlevsen, S. Warning of a forthcoming collapse of the Atlantic meridional overturning circulation. Nat Commun 14, 4254 (2023). https://doi.org/10.1038/s41467-023-39810-w ↩︎
SMH, 2023, A critical Antarctic current has scientists talking about The Day After Tomorrow ↩︎
Duchez, A. et al 2016 Environ. Res. Lett. 11 074004 https://doi.org/10.1088/1748-9326/11/7/074004 ↩︎
IPCC, 2019, FAQ chapter 6 in IPCC Special Report on the Ocean and Cryosphere in a Changing Climate https://www.ipcc.ch/srocc/about/faq/final-faq-chapter-6/ ↩︎
Caesar, L., McCarthy, G.D., Thornalley, D.J.R. et al. Current Atlantic Meridional Overturning Circulation weakest in last millennium. Nat. Geosci. 14, 118–120 (2021). https://doi.org/10.1038/s41561-021-00699-z ↩︎
Ditlevsen, P., Ditlevsen, S. Warning of a forthcoming collapse of the Atlantic meridional overturning circulation. Nat Commun 14, 4254 (2023). https://doi.org/10.1038/s41467-023-39810-w ↩︎
RealClimate, 2023, What is happening in the Atlantic Ocean to the AMOC ↩︎
NOAA, August 2023, ENSO strengths; BOM, August 2023, ENSO Climate driver update ↩︎
360 info, 2023, Why we won’t have a super El Niño this year ↩︎
Cai, W., Ng, B., Geng, T. et al. Anthropogenic impacts on twentieth-century ENSO variability changes. Nat Rev Earth Environ 4, 407–418 (2023). https://doi.org/10.1038/s43017-023-00427-8 ↩︎
The Conversation, 2023, Four possible consequences of El Niño returning in 2023 ↩︎
World Weather Attribution, 2023, Extreme heat in North America, Europe and China in July 2023 made much more likely by climate change ↩︎
Climate.copernicus.eu, 2023, July 2023: Global air and ocean temperatures reach new record highs ↩︎
Climate.copernicus.eu, 2023, July 2023: Global air and ocean temperatures reach new record highs ↩︎
Speer, M.S., Leslie, L.M. and Hartigan, J., Jet Stream Changes over Southeast Australia during the Early Cool Season in Response to Accelerated Global Warming, Climate 2022, 10(6), 84; https://doi.org/10.3390/cli10060084 ↩︎
Hallam, S., Josey, S.A., McCarthy, G.D. et al. A regional (land–ocean) comparison of the seasonal to decadal variability of the Northern Hemisphere jet stream 1871–2011. Clim Dyn 59, 1897–1918 (2022). https://doi.org/10.1007/s00382-022-06185-5 ↩︎
Ren, D., R. Fu, R. E. Dickinson, L. M. Leslie, and X. Wang, 2020: Aviation Impacts on Fuel Efficiency of a Future More Viscous Atmosphere. Bull. Amer. Meteor. Soc., 101, E1761–E1780, https://doi.org/10.1175/BAMS-D-19-0239.1. ↩︎
Severe Weather Europe, 2023, A Record-Challenging Heatwave heads for Spain late this week. Extreme April Temperatures close to +40 °C possible ↩︎
The Conversation, 2019, The stubborn high-pressure system behind Australia’s record heatwaves ↩︎
Bloomberg, 2023, Canada’s Record Wildfire Season Set to Worsen as Heat Builds ↩︎
Royal Commission into National Natural Disaster Arrangements, 2020, Royal Commission into National Natural Disaster Arrangements Report ↩︎
The New York Times, 2023, How Canada's record wildfires got so bad, so fast ↩︎
Mitchell, D. et al 2016 Environ. Res. Lett. 11 074006 https://doi.org/10.1088/1748-9326/11/7/074006\ ↩︎
Munich RE, 2011, Münchener Rückversicherungs-Gesellschaft, Geo Risks Research, NatCatSERVICE ↩︎
Climate.copernicus.eu, 2022, Drought ↩︎
Ballester, J., Quijal-Zamorano, M., Méndez Turrubiates, R.F. et al. Heat-related mortality in Europe during the summer of 2022. Nat Med 29, 1857–1866 (2023). https://doi.org/10.1038/s41591-023-02419-z ↩︎
Rousi, E., Kornhuber, K., Beobide-Arsuaga, G. et al. Accelerated western European heatwave trends linked to more-persistent double jets over Eurasia. Nat Commun 13, 3851 (2022). https://doi.org/10.1038/s41467-022-31432-y ↩︎
Nabizadeh, E., Hassanzadeh, P., Yang, D., & Barnes, E. A. (2019). Size of the atmospheric blocking events: Scaling law and response to climate change. Geophysical Research Letters, 46, 13488–13499. https://doi.org/10.1029/2019GL084863 ↩︎
CarbonBrief, 2020, Jet stream: Is climate change causing more ‘blocking’ weather events? ↩︎
CarbonBrief, 2023, State of the climate: 2023 now likely hottest year on record after extreme summer ↩︎
IPCC, 2023: Summary for Policymakers. In: Climate Change 2023: Synthesis Report. Contribution of Working Groups I, II and III to the Sixth Assessment Report of the Intergovernmental Panel on Climate Change, https://doi.org/10.59327/IPCC/AR6-9789291691647.001 ↩︎
Get email updates about new ACCR research and shareholder advocacy on specific topics of interest to you.
Sign Up