If we view the future impacts of climate change as similar to ever-increasing provisions on a planetary balance sheet, we see that future costs and impairments are getting uncomfortably likely.
With science increasingly pointing to the physical difficulty of limiting global temperature rise to 1.5°C this century, raising the likelihood of “tipping points” that irreversibly shift the climate, major costs and consequences are on the horizon.
The costs of failing to meet the goals of the Paris Agreement dwarf those of succeeding - underscoring the need for maximum ambition and action now.
Key points:
- Estimates of the remaining carbon budget left if we are to have a 50% chance of limiting global warming to 1.5°C have recently been drastically slashed, to half that of just two years ago. At current emissions rates there is just six years of carbon budget left - a mere 250Gt CO2.
- The downward revision is partly due to growing global emissions since the pandemic dip and a better understanding of how to account for non-CO2 gases.
- The further above 1.5°C we are during the 21st century, the more likely tipping points become, with the latest research highlighting that four tipping points are now staring us in the face - with the potential to irreversibly shift the climate into another steady state, one previously unknown to humankind.
- To date, economic models that seek to estimate the financial costs associated with climate change have routinely underestimated the costs. New analysis incorporating more complex interactions, known as “damage functions”, show much higher costs - with damages 1.5 to 4 times higher than the cost of mitigation.
- While it could be technically feasible to reduce global mean surface temperature back down to 1.5°C from a higher temperature - if the Paris goals are breached - it would require massive amounts of carbon removals using technologies still far from development at a relevant scale and coming with inordinate cost. Reducing global temperatures by 0.1°C, assuming a $100/t CO2 removed, would cost some 22 trillion dollars.
- The economic and safety benefits of limiting global warming to 1.5°C far outweigh the costs.
The provisions are threatening the planet’s solvency.
It’s well established that economic models seeking to estimate the financial costs associated with climate change routinely underestimate the costs. [1–3] Various publications have argued that the economic impact of heating the planet to 3°C has minimal impact on global GDP. [4–6] However, these models:
- cannot account for the deep uncertainties and extreme risk that come with climate change. The mathematical functions used within the models are relatively simple and unable to accurately reflect the complex and compounding nature of future climate impacts.
- discount the future, an approach that embeds intergenerational inequity.[3]
However, analysis using new climate damage functions - that incorporate more complex interactions - shows a much higher cost than the estimates often used. The term “avoided damages” is used to quantify the economic benefit of less global warming or avoiding a certain amount of cumulative emissions. Avoided damages are 1.5 to almost 4 times higher than the cost of mitigation (in a ~3°C world vs a ~1.8°C world).[7] And these impacts do not include biodiversity, human health and tipping points, so the benefit is still likely underestimated.[8]
Moreover, it’s been established that the benefits of limiting global warming to 1.5°C outweigh the costs because of the escalating chances of tipping points being breached above 1.5°C and the flow on effects to livelihoods, economies, communities and the environments when this occurs.[9]
We’ve already seen indications that developed and developing economies are being impacted by climate change:
- Brazil's economy is slowing because the Amazon is drying out.[10]
- Profits of Australian farmers have declined by 23% compared to historical averages because of climate change (2001-2020 vs 1950-2000).[11]
- Drought has impacted hydropower generation worldwide (-8.5%), particularly in China.[12] This has forced China to generate more coal-fired power, with severe air quality implications.
- More than 3 million people in Eastern Africa have been affected by recent flooding, following the drought that was strongly exacerbated by climate change and displaced more than 19 million people.[13–15]
Lloyd’s of London recently put the cost of climate change at US$3.6 to 17.6 trillion over a five year period.[16] Lloyd’s includes the impact of a global extreme weather event, impacting agricultural yields and harvests and the cascading effects through global supply chains.
While mapping precise costs is still not possible, waiting for a trillion-dollar annual figure for the costs of physical impacts of climate change does not seem prudent - with the weight of evidence suggesting more urgent action to reduce emissions is the least-risk option. Assessment of future costs should also consider:
- the annual seven trillion dollars in subsidies for fossil fuels[17], and
- the five to ten trillion dollars in environmental costs that the world did not pay for last year. [18,19]
- the systemic risks to universal owners. The Investor Initiative on Hazardous Chemicals spelled out the trillion dollar impact of chemicals to business reputation, liability risks, and systemic risks to universal owners,[20] an approach also applicable to climate change related risks.
Vanishing allowable emissions
The recent revision of the remaining carbon budget to limit global warming to 1.5°C by Lamboll et al.[21] should make “for uncomfortable reading for policymakers”[22] and COP28 attendees, reducing the remaining carbon budget from 500Gt to a mere 250Gt (see Figure 1). This represents a halving of the remaining budget published in the 2021 IPCC Working Group 1 (WG1) report.[23]
This leaves us six years at current emission rates.[21]
The downward revision is partly due to:
- growing global emissions since the pandemic emissions dip
- a better understanding of how to account for non-CO2 gases.
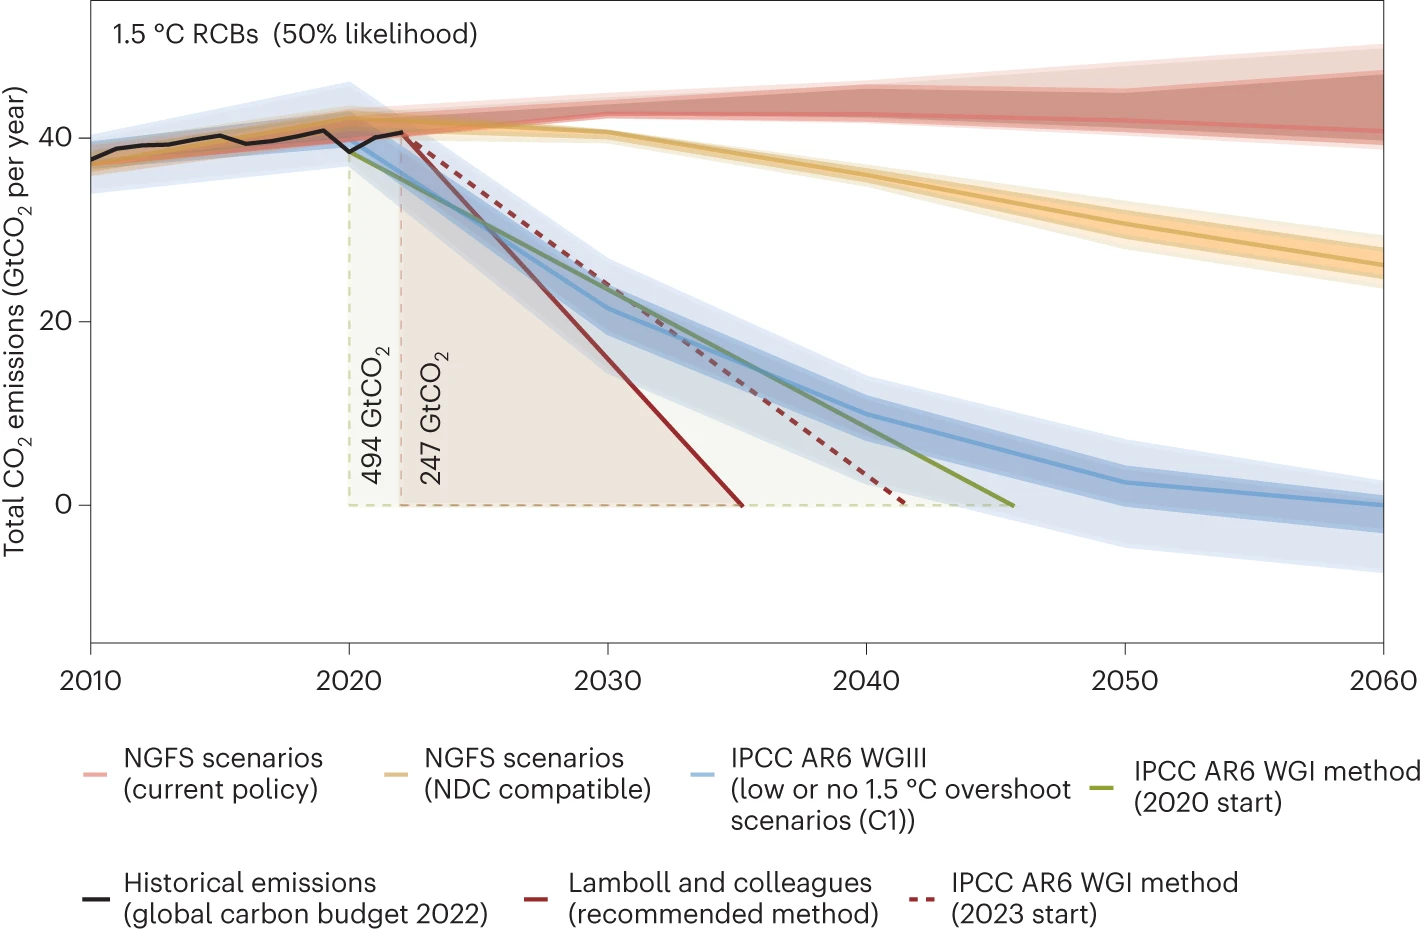
Figure 1: An illustration that compares the remaining carbon budget defined by the IPCC WG1 and Lamboll et al., 2023. The budgets are triangles that reduce to zero from the year 2020 (IPCC budget, light green) and from the year 2023 (Lamboll et al., red). The dashed red line is the IPCC budget minus the 2020-2023 emissions. Different scenarios are shown until 2060 with IPCC scenarios with low or now overshoot (in blue), and Network for Greening the Financial System (NGFS) scenarios based on current policies (in red) and National Determined Contribution (NDC) compatible scenarios (in yellow). The shadings around the median scenario lines represent 25-75th and 5-95th percentile ranges. Taken from Sanderson, 2023.[22]
The ‘unforeseen’ kicks of non-CO₂ emissions
Non-CO₂ emissions play an important role in short-term warming. Reducing methane emissions fast will impact global warming in the short term, because methane has:
- a very high global warming potential
- a short lifetime in the atmosphere.
Reducing methane emissions to zero can delay peak temperatures and reduce warming by 0.5°C, depending on the time of the reduction.
However, a warming effect of +0.4°C is also expected to occur while we are trying to get CO2 emissions to zero (see Figure 2).[24] When fossil fuels are burnt, they produce aerosols, primarily sulphate aerosols, as a by-product. The aerosols prevent sunlight interacting with greenhouse gases, masking the true warming.
The decline in coal and diesel use will:
- reduce aerosols in the atmosphere.
- remove the cooling effect of aerosols, unmasking the true warming.
We will subsequently approach 1.5°C very quickly when we drastically reduce coal use at 1.3°C, where we are today. The only way to ease[1] that short-term warming in forecast scenarios is by changing other assumptions to counter this warming kick.
One of these forecast scenarios is the IEA NZE scenario. The 2023 update showed that:[25]
- all levers to achieve 1.5°C require extraordinary effort
- some levers have shown promising progress (e.g. solar and EV uptake).25 Others have not.
Our view is that the IEA had to make some significant changes to assumptions because they needed to factor in previously unforeseen realities:
- the additional warming associated with reduced aerosols in the atmosphere from coal use decline.
- the increase in short term fossil fuel demand and emissions due to the Russian invasion of Ukraine.
- the lack of progress of several levers.
The IEA NZE 2023 update requires, for example:
- Deforestation to be halted, globally, by 2030. This is a major change from reducing deforestation by ⅔ in 2050 in the initial NZE release in 2021.[26]
- behaviour change in air travel and cooling and heating homes,[27]
- methane emissions within the energy sector to be reduced by 75% by 2030.
It is worth noting that these assumptions are highly ambitious. If they are not met, the required decline rate of carbon emissions in the energy sector will be even steeper - underscoring the fact that there is most likely even less room for new fossil fuels.

Figure 2: Projected changes in global mean surface temperatures in different scenarios: no CO2 emissions (in blue), no CO2 and aerosol emissions (in red), no greenhouse gas (GHG) emissions (in yellow), and no GHG and aerosol emissions (in purple). Historical temperature increases are in black. Chart created by Carbon Brief, based on Figure 1.5 from the IPCC SR1.5 report.
Drifting towards tipping points and an altered steady state
A useful way to think of a tipping point is like a marble that wobbles in a hole being suddenly, through some force, tipped into a different hole (see Figure 3).
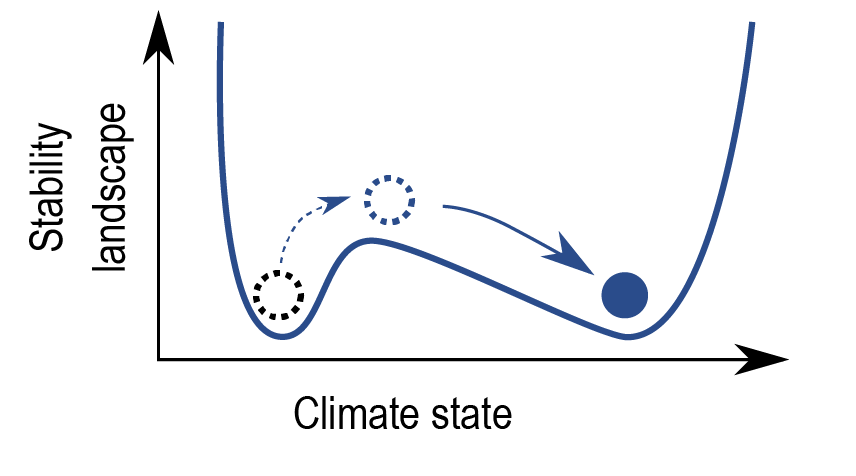
Figure 3: Illustration of the stability landscape of tipping point. The (climate) state is stable in the ‘valley’ with a ‘hilltop’ separating different stable states. The state of the system is represented by the marble. A large perturbation, or a series of perturbations, can force the system over the hilltop into an alternative state. Picture amended from figure 1.17, IPCC, 2021, Chapter 1 In: Climate Change 2021: The Physical Science Basis. Contribution of Working Group I to the Sixth Assessment Report of the Intergovernmental Panel on Climate Change
We find ourselves drifting ever closer towards tipping points because:
- the further above 1.5°C we are during the 21st century, the more likely tipping points become
- latest research highlights that four tipping points are staring us in the face,[28] with the potential to shift the climate into another, but very different, steady state. A state the planet will not wobble out of very easily and which will be unknown to humankind.
The map in Figure 4 provides a good insight when tipping points could occur and how likely they are to occur given the current climate policies around the world.
Global Tipping Points
Figure 4: World map depicting the tipping points with global and regional impact, as identified by Armstrong McKay et al., 2023.[28] Click on the icons for a visualisation of the warming relative to 1850-1900 and a likelihood representation of tipping points occurring with today’s warming, with existing policies and with the Paris agreement implemented. For source data, see below.
The warming kicks from non-CO2 emissions mean that in order to achieve the goal of 1.5°C in the year 2100, global mean surface temperatures will need to be reduced from higher temperatures.
The overall impact from reducing non-CO2 emissions to zero and the response from natural CO2 sinks may be a small overall cooling effect (-0.2°C ± 0.5°C), but we can’t rely on this to deliver the required reduction in global temperatures. It is technically feasible to reduce the global mean surface temperature back down to a 1.5°C increase from a higher temperature. But:
- it requires massive amounts of carbon removals to reduce CO2 concentrations.[29] These technologies are very far from development at a climate relevant scale.
- it would cost a fortune: to reduce global temperatures by a mere 0.1°C, assuming a $100/t CO2 removed, would cost some 22 trillion dollars.[30]
- the Paris Agreement should additionally be interpreted as an agreement to reduce warming from wherever we end up: stabilising temperatures at a given level is not part of the Paris Agreement text.[29] The further above 1.5°C we find ourselves during the 21st century, the more carbon removal is required in extraordinarily unsustainable amounts to get back down to 1.5°C by 2100.
- we also know that CO2 emissions are better at warming the planet than CO2 removals are at cooling the planet. [31]
Can we see warning signs that ‘subprime’ tipping points are approaching?
What signals would reveal the onset of a tipping point, akin to signals that were visible to some in the subprime crisis in 2007, a recent black swan event? Identifying such signals on a timeframe that permits their meaningful mitigation might be difficult because:
scientists argue it’s very possible these slow-responding physical processes fail to provide early warning signs as they are simply slow to respond.[32]
some signals become clear only when it may be too late:
- whatever emissions reductions we commit to, the West Antarctic ice sheet (WAIS) will continue to melt.[33] Total collapse will lead to 5 metres of sea level rise over the next centuries.
- parts of the Amazon are turning into a carbon source.[34,35] This could be a first sign of the Amazon tipping point (see Figure 4), but the uncertainties are large.
Elsewhere, the ever-rising concentration of methane in the atmosphere is also an ongoing conundrum for scientists, who have struggled to explain the acceleration for more than a decade-and-a-half. Research has shown that:
the origin of this methane has become more biogenic - with 85% of the methane emissions coming from natural sources (i.e. not fossil fuels or bush fires).[36]
it is not the result of higher than expected fugitive methane emissions from the oil and gas boom in the US [37–41] or the relentless growth in Chinese fossil fuel consumption.
it is the result of climate change-fuelled growth in tropical forests and Siberian wetlands, with evidence linking an increase in methane emissions to:
- a higher volume of rainfall, which makes wetlands wetter and larger, and
- higher temperatures, which increases plant growth, leading to the production of methane when plants decompose.[36]
It’s important to understand this conundrum does not mean a dispute over emission sources. But translating those known or calculated emissions into global concentrations is more difficult.
This sudden surge in methane is also not unprecedented: during the ice ages it marked the transition into a much warming climate, from an ice age to warm interglacial periods (also called termination-level transitions). Are we witnessing the first signs of a runaway climate response of tipping the planet into a much warmer climate?[42]
It arguably sounds apocalyptic and while the research presently states it may still be within the Holocene ranges, the rate of change is similar to previous termination events, and the evidence is mounting.
A recent study led by Professor James Hansen[43], argues that:
- warming is accelerating, and the world will reach 1.5°C this decade, and 2°C will be passed before 2050
- the reduction in aerosols is the main reason for the recent acceleration in warming, rather than the acceleration in methane emissions.
- the climate is much more sensitive to greenhouse gas variations than previously understood, leading to 4.8°C warming if CO2 emissions double compared to pre-industrial times, rather than the 3°C estimated by the IPCC WG1.
The possibility of a termination-level transition being plausible emphasises that we should take the findings by Hansen on board and take more rapid measures to accelerate our transition to a cleaner energy system.
Data for Figure 4:
Left: Four models: HadCRUT 5.0 (Maurice et al., 2021), Kadow et al. (2020), NOAAGlobalTemp (Vose et al., 2021) and Berkeley Earth (Rohde and Haufather, 2020) ). Source: https://data.ceda.ac.uk/badc/ar6_wg1/data/ch_02/ch2_fig11/v20220510 (Kaufman, D.; Trewin, B.; Fawcett, R.; Kennedy, J.; Neukom, R. (2023): Chapter 2 of the Working Group I Contribution to the IPCC Sixth Assessment Report - data for Figure 2.11 (v20220510). NERC EDS Centre for Environmental Data Analysis, 03 July 2023. doi:10.5285/f3515388768344bfb2be0521f82388be . https://dx.doi.org/10.5285/f3515388768344bfb2be0521f82388be. Also see IPCC, 2021, WG1 section 2.3.1.1.3. Lowess smoothing applied to coloured lines. 2023 range taken Carbonbrief's analysis (1.29-1.53C) based on NOAA Globaltemp and Berkeley Earth data (https://www.carbonbrief.org/analysis-greater-than-99-chance-2023-will-be-hottest-year-on-record/ ).
Right: Tipping point data from D. I. Armstrong McKay et al., Science 377, eabn7950 (2022). DOI: 10.1126/science.abn7950. Current policy scenarios from UNEP, 2023, Emission Gap Report; Climate Action Tracker, 2022, The CAT thermometer; IEA, 2023, World Energy Outlook.
References and further reading:
- Trust, S., Joshi, S., Lenton, T. & Oliver, J. The emperor’s new climate scenarios. 31 https://actuaries.org.uk/media/qeydewmk/the-emperor-s-new-climate-scenarios.pdf (2023).
- University of Exeter & Universities Superannuation Scheme (USS). No time to lose. /https://greenfuturessolutions.com/wp-content/uploads/2023/09/No-Time-To-Lose-New-Scenario-Narratives-for-Action-on-Climate-Change-Full-Report.pdf (2023).
- Stern, N., Stiglitz, J. & Taylor, C. The economics of immense risk, urgent action and radical change: towards new approaches to the economics of climate change. Journal of Economic Methodology 29, 181–216 (2022).
- Kahn, M. E. et al. Long-term macroeconomic effects of climate change: A cross-country analysis. Energy Economics 104, 105624 (2021).
- Australian Government (The Treasury). 2023 Intergenerational Report | Treasury.gov.au. https://treasury.gov.au/publication/2023-intergenerational-report (2023).
- Neal, T. Have some economists severely underestimated the financial hit from climate change? Recent evidence suggests yes. The Conversation http://theconversation.com/have-some-economists-severely-underestimated-the-financial-hit-from-climate-change-recent-evidence-suggests-yes-214579 (2023).
- van der Wijst, K.-I. et al. New damage curves and multimodel analysis suggest lower optimal temperature. Nat. Clim. Chang. 13, 434–441 (2023).
- Kikstra, J. S. & Waidelich, P. Strong climate action is worth it. Nat. Clim. Chang. 13, 419–420 (2023).
- Hoegh-Guldberg, O. et al. The human imperative of stabilizing global climate change at 1.5°C. Science 365, eaaw6974 (2019).
- Capurro, M. E. Amazon Damage Could Cost Brazil $184 Billion, World Bank Says. Bloomberg.com (2023).
- Hughes, N., Lu, M., Soh, W. Y. & Lawson, K. Modelling the effects of climate change on the profitability of Australian farms. Climatic Change 172, 12 (2022).
- Wiatros-Motyka, M. & Fulghum, N. Global Electricity Mid-Year Insights 2023. Ember https://ember-climate.org/insights/research/global-electricity-mid-year-insights-2023/ (2023).
- UN Office for the Coordination of Humanitarian Affairs. Eastern Africa: El Niño Impact Snapshot (November 2023) - Somalia | ReliefWeb. https://reliefweb.int/report/somalia/eastern-africa-el-nino-impact-snapshot-november-2023 (2023).
- CarbonBrief. Deadly drought in Horn of Africa ‘would not have happened’ without climate change - Carbon Brief. https://www.carbonbrief.org/deadly-drought-in-horn-of-africa-would-not-have-happened-without-climate-change/ (2023).
- Kimutai, J., Barnes, C., Zachariah, M. & Philip, S. Human-induced climate change increased drought severity in Horn of Africa. https://spiral.imperial.ac.uk/bitstream/10044/1/103482/16/Scientific report-East_Africa_Drought_Final.pdf (2023).
- Lloyd’s of London. Lloyd’s new data tool highlights vulnerability of the global economy to extreme weather. https://www.lloyds.com/about-lloyds/media-centre/press-releases/lloyds-new-data-tool-highlights-vulnerability-of-the-global-economy-to-extreme-weather (2023).
- IMF. Fossil Fuel Subsidies Surged to Record $7 Trillion. IMF https://www.imf.org/en/Blogs/Articles/2023/08/24/fossil-fuel-subsidies-surged-to-record-7-trillion (2023).
- Vernon, S. B., Antung A. Liu,Ian W. H. Parry,Nate. IMF Fossil Fuel Subsidies Data: 2023 Update. IMF https://www.imf.org/en/Publications/WP/Issues/2023/08/22/IMF-Fossil-Fuel-Subsidies-Data-2023-Update-537281 (2023).
- Rennert, K. et al. Comprehensive evidence implies a higher social cost of CO2. Nature 610, 687–692 (2022).
- Investor Initiative on hazardous chemicals. Investor Initiative on Hazardous Chemicals (IIHC). https://chemsec.org/knowledge/iihc/ (2023).
- Lamboll, R. D. et al. Assessing the size and uncertainty of remaining carbon budgets. Nat. Clim. Chang. 1–8 (2023) doi:10.1038/s41558-023-01848-5.
- Sanderson, B. M. Estimating vanishing allowable emissions for 1.5 °C. Nat. Clim. Chang. 1–2 (2023) doi:10.1038/s41558-023-01846-7.
- Canadell, J. G., Monteiro, P. M. S., Costa, M. H. & L. Cotrim da Cunha, P.M. Cox, A.V. Eliseev, S. Henson, M. Ishii, S. Jaccard, C. Koven, A. Lohila, P.K. Patra, S. Piao, J. Rogelj, S. Syampungani, S. Zaehle, and K. Zickfeld. Global Carbon and other Biogeochemical Cycles and Feedbacks. In Climate Change 2021: The Physical Science Basis. Contribution of Working Group I to the Sixth Assessment Report of the Intergovernmental Panel on Climate Change. Cambridge University Press, Cambridge, United Kingdom and New York, NY, USA, 673-816, (2021) doi:doi: 10.1017/9781009157896.007.
- Hausfather, Z. Explainer: Will global warming ‘stop’ as soon as net-zero emissions are reached? Carbon Brief https://www.carbonbrief.org/explainer-will-global-warming-stop-as-soon-as-net-zero-emissions-are-reached/ (2021).
- IEA. Net Zero Roadmap: A Global Pathway to Keep the 1.5 °C Goal in Reach. IEA https://www.iea.org/reports/net-zero-roadmap-a-global-pathway-to-keep-the-15-0c-goal-in-reach (2023).
- IEA. Net Zero by 2050 – A Roadmap for the Global Energy Sector. IEA https://www.iea.org/reports/net-zero-by-2050 (2021).
- CarbonBrief. Q&A: Why deals at COP28 to ‘triple renewables’ and ‘double efficiency’ are crucial for 1.5C - Carbon Brief. https://www.carbonbrief.org/qa-why-deals-at-cop28-to-triple-renewables-and-double-efficiency-are-crucial-for-1-5c/ (2023).
- Armstrong McKay, D. I. et al. Exceeding 1.5°C global warming could trigger multiple climate tipping points. Science 377, eabn7950 (2022).
- Schleussner, C.-F., Ganti, G., Rogelj, J. & Gidden, M. J. An emission pathway classification reflecting the Paris Agreement climate objectives. Commun Earth Environ 3, 1–11 (2022).
- Tollefson, J. Is it too late to keep global warming below 1.5 °C?The challenge in 7 charts. https://www.nature.com/immersive/d41586-023-03601-6/index.html (2023).
- Zickfeld, K., MacDougall, A. H. & Matthews, H. D. On the proportionality between global temperature change and cumulative CO2 emissions during periods of net negative CO2 emissions. Environ. Res. Lett. 11, 055006 (2016).
- Intergovernmental Panel on Climate Change (IPCC). Chapter 1: Framing, Context, and Methods. in Climate Change 2021 – The Physical Science Basis: Working Group I Contribution to the Sixth Assessment Report of the Intergovernmental Panel on Climate Change 147–286 (Cambridge University Press, 2023). doi:10.1017/9781009157896.003.
- Naughten, K. A., Holland, P. R. & De Rydt, J. Unavoidable future increase in West Antarctic ice-shelf melting over the twenty-first century. Nat. Clim. Chang. 13, 1222–1228 (2023).
- Gatti, L. V. et al. Amazonia as a carbon source linked to deforestation and climate change. Nature 595, 388–393 (2021).
- Gatti, L. V. et al. Increased Amazon carbon emissions mainly from decline in law enforcement. Nature 621, 318–323 (2023).
- Nisbet, E. G. et al. Atmospheric Methane: Comparison Between Methane’s Record in 2006–2022 and During Glacial Terminations. Global Biogeochemical Cycles 37, e2023GB007875 (2023).
- Pétron, G. et al. Hydrocarbon emissions characterization in the Colorado Front Range: A pilot study. Journal of Geophysical Research: Atmospheres 117, (2012).
- Barkley, Z. et al. Quantification of oil and gas methane emissions in the Delaware and Marcellus basins using a network of continuous tower-based measurements. Atmospheric Chemistry and Physics 23, 6127–6144 (2023).
- Rutherford, J. S. et al. Closing the methane gap in US oil and natural gas production emissions inventories. Nat Commun 12, 4715 (2021).
- Peischl, J. et al. Quantifying atmospheric methane emissions from oil and natural gas production in the Bakken shale region of North Dakota. Journal of Geophysical Research: Atmospheres 121, 6101–6111 (2016).
- Karion, A. et al. Methane emissions estimate from airborne measurements over a western United States natural gas field. Geophysical Research Letters 40, 4393–4397 (2013).
- Nisbet, E. Rising methane could be a sign that Earth’s climate is part-way through a ‘termination-level transition’. The Conversation http://theconversation.com/rising-methane-could-be-a-sign-that-earths-climate-is-part-way-through-a-termination-level-transition-211211 (2023).
- Hansen, J. E. et al. Global warming in the pipeline. Oxford Open Climate Change 3, kgad008 (2023).
Download Climate Science Insight: Delay now, pay later | 08/12/23
Please read the terms and conditions attached to the use of this site.
[1]: The additional warming through aerosol reduction will be within 2 to 5 years, while reduced warming through methane emission reduction is on a ~10 year timeframe. Hence ‘ease’ not ‘cancel out’